↧
KDAB on Qt: KDDockWidgets 1.0 has been released!
↧
The Qt Company Blog: Qt Design Studio 1.6.1 released

We are happy to announce the release of Qt Design Studio 1.6.1!

↧
↧
Francesc M. Qt Blog: Released GitQlientPlugin 1.2.0 for QtCreator
I’m happy to announce the release of GitQlientPlugin 1.2.0
A month ago I released the version 1.1.0 of GitQlient. With that I shipped some improvements, a few fixes and a big new functionality I was missing: the Merge view.
I still have to add some features and add OSX support in GitQlient, but for now the code is fully compatible with the three big ones (Linux, Mac and Windows).
What was missing is some fixes at plugin level, even that I’ve tried to be on track with it, I prefer to focus on GitQlient as app. However, after a month I think I have a stable version of the plugin that can be ship or at least published as version.
I’ve generated two binaries: one for Linux, compiled with GCC 5.3.1 and another with MSVC2017 32bits. The main reason is because those are the compilers that QtCreator uses and then I make sure that the dependencies, that are shipped as dynamic libraries work well. As you can see, Mac is still the pending task.
The binaries
You can find the binaries for GitQlientPlugin 1.2.0 on the release section on the GitHub repo:
Further work
Since GitQlientPlugin is a wrap of GitQlient, you can see the release planning and all the features that every release will contain in the Release Plan for GitQlient.
As always, if you’d like some feature or you’re missing something in GitQlient or in GitQlientPlugin, check that it’s not yet in the backlog and open an issue on GitHub!
Released GitQlientPlugin 1.2.0 for QtCreator first appeared on My C++ & Qt blog - Cesc M..
↧
Felgo: Release 3.6.0: Modal Dialogs and iOS Storyboard Support for Qt & Felgo
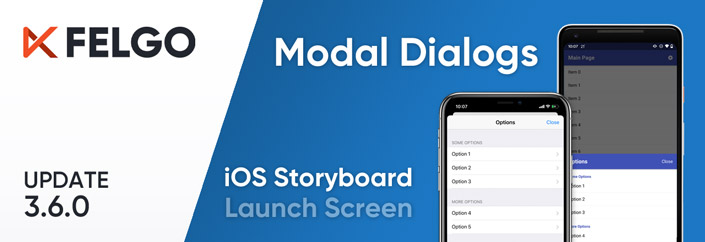
Felgo 3.6.0 adds the new AppModal component to display modal dialogs in your apps. You can use this component for both full-screen and custom-height modal dialogs.
On iOS, you can now use Storyboard files to create your app launch screen. This update also adds new components and several improvements and fixes.

↧
Francesc M. Qt Blog: How to pin tabs in QTabWidget
↧
↧
Latest from LearnPyQt: PyQt5/PySIde2 Book Create GUI Applications with Python & Qt5 (4th Edition) now available
Hello! This morning I released a new update to my PyQt5 book Create GUI Applications, with Python & Qt5. This is an enormous update, expanding it from 258 to 665 pages and adding 211 complete code examples.
To celebrate the milestone the book is available this week with 20% off. Readers get access to all future updates for free, so it's a great time to snap it up!

This is the 4th Edition of the book and adds a number of entirely new chapters including MVC-like model views, SQL database-views, plotting with matplotlib & PyQtGraph, custom widgets & bitmap graphics, concurrent programming with threads and processes and theming Qt applications.
Existing chapters have been expanded with more examples and step-by-step guides to using them. All source code shown in the book is available as standalone, runnable, examples to try out and experiment with.

Chapters have been updated and expanded with new examples and more detailed explanations and diagrams. Cross-platform screenshots show how your application will look on different systems. Starting from the basic principles of GUI development in Python and building up to more complex topics.

Learn how to use Qt's MVC-like model views architecture to sync data with widgets, including querying and editing SQL databases from within your applications.

Tired of the default application look? Use styles, palettes and Qt Style Sheets to completely customize the look and feel of your applications.

Discover how to create your own widgets to use in your Qt applications. Starting from the basics of bitmap graphics and building up to a fully-customizable widgets.

Use threads an processes to perform long-running calculations or communicate with remote services, without locking up your applications. Receive data back from threads and processes and display progress bars. Stop and pause running jobs from your UI.

Visualize data inside your applications, using matplotlib or PyQtGraph. Sync plots with external threads to create live updating dashboards to visualize data in real-time.
There is also a PySide2 edition of the book available, which features largely the same content, with examples converted to "Qt for Python". Purchasing either book gets you access to both editions, including any future updates of either.
Feedback, as always is very welcome!
↧
Francesc M. Qt Blog: New GitQlient v1.1.1 (+ Mac)
There is available a patch for the version 1.1 of GitQlient.
The new patch version solves a problem with new repositories. The problem prevented users to work with repositories that have no commits. That applies to both new repositories (via init new repo) and already created repos that don’t have any commits.
I took advantage of this issue to release also a release for OSX. It’s as functional as I would expect to have it in the next 1.2.0. However, I’d like if people can test it before going into the next release.
The binaries
You can find the binaries for GitQlient v1.1.1 on the release section on the GitHub repo:
- GitQlient for Linux (AppImage)
- GitQlient for Windows (Installer)
- GitQlient for Mac (DMG)
- Download Source code
New GitQlient v1.1.1 (+ Mac) first appeared on My C++ & Qt blog - Cesc M..
↧
pat26 MARGINALIA blog: Qt & Android: Job Scheduler
Description
This tutorial describes how to schedule tasks in a Qt app for Android using Android's JobScheduler API. If your Android app needs to perform a repetitive task whether the app is active or not, you should consider creating an Android app with a JobService to perform the work. You can add one or more job services, where each one defines a different task that is performed in the future based upon specified conditions. The tasks can even survive application restarts and device reboots.
Source code
The following highlights the steps needed to create an Android app using Qt and Android JobScheduling API. The complete sample app is found in Github at https://github.com/pgulotta/JobServiceExample.
Getting Started
Create a new Qt Quick empty project naming it JobServiceExample. The app will link against the Qt Android Extras module, so add this line to the project file:
android:QT += androidextras
This sample app displays a message box, so you need to add entry to support the QMessageBox class.
QT += widgets
Create Android Package Templates files. This can be easily done with QtCreator. If you are creating the Templates manually and you need assistance, refer to the Qt for Android documentation.
Verify the app was generated correctly by building all Android ABI's and deploying your new app onto an Android device or emulator. Upon successfully running your new Android app, it's time to make the changes needed to create a job scheduling service.
Update AndroidManifest.xml
In the AndroidManifest.xml, name the package following the normal java package naming conventions. The JobServiceExample package name is com.example.jobserviceexample. The AndroidManifest.xml file should contain an entry similar to this.
xmlns:android="http://schemas.android.com/apk/res/android"
android:versionName="100" android:versionCode="100" android:installLocation="auto">
There are several other changes to make to the AndroidManifest.xml and now is as good a time as any. The job scheduling api requires a minimum android version. Specify the supported Android sdk, with an entry such as this.
In the AndroidManifest.xml file , the JobServiceExample must be declared as a service with the BIND_JOB_SERVICE permission. The name JobServiceExample is the name of the Java class you will be creating.
android:permission="android.permission.BIND_JOB_SERVICE"/>
Because Android will run the job, per the job's defined schedule, after the system has finished booting, the RECEIVE_BOOT_COMPLETED permission is needed.
The sample app scheduled task is to append a line of text composed of a time stamp to a file periodically. Thus, the permission WRITE_EXTERNAL_STORAGE is required.
Please refer to the sample app, if you are unsure as to what the AndroidManifest.xml entries are.
JobScheduler Java API
An Android service is a component that runs in background and has no user interface. The service will continue to run even if the application exits. The work or task you are scheduling is known as a 'job' and is defined in a Java class which enables Android to perform the work, even when the app is not active. Refer to Android documentation for details.
Java files belong to the package specified in the AndroidManifest.xml file. Java files called by Qt application must be placed in a directory which conforms to the path hierarchy defined by the package name. Create a java class called JobServiceExample.class which extends android.app.job.JobService in the directory ...JobServiceExample/android/src/com/example/jobserviceexample. This Java class is an Android Service that extends the Android JobService class. Since JobServiceExample class extends the JobService class, a couple of methods must be implemented: onStartJob(), which is called by the system when the job has begun executing, and onStopJob(), which is called by the system if the job is cancelled before finishing. Note, JobServiceExample class runs on the main thread so the task should be run on a worker thread.
@Override
public boolean onStartJob( JobParameters jobParameters )
{
Log.i( TAG, "JobServiceExample.onStartJob : jobParameters.getJobId() = " +
jobParameters.getJobId() );
try {
Thread thread = new Thread( new ExampleWork( this ) );
thread.start();
thread.join();
} catch ( Exception e ) {
e.printStackTrace();
}
return false; // Returns false from when job has finished. onStopJob will not be invoked
}
@Override
public boolean onStopJob( JobParameters jobParameters )
{
// This method is typically not invoked
Log.i( TAG, "JobServiceExample.onStopJob : jobParameters.getJobId() = " +
jobParameters.getJobId() );
return false; // Returns false to end the job entirely
}
The class ExampleWork specified above implements Runnable. For this example, the task is to append a line of text composed of a timestamp to a file.
@Override
public void run()
{
...
doWork( mContext );
...
}
public static void doWork( Context context )
{
try {
SimpleDateFormat dateFormat = new SimpleDateFormat("yyyy-MM-dd HH:mm:ss");
String textToAppend = dateFormat.format(new Date());
File path = Environment.getExternalStoragePublicDirectory(
Environment.DIRECTORY_DOWNLOADS );
String filename = path.getAbsolutePath() + File.separatorChar +
"JobServiceExampleLog.txt";
Log.i( TAG, "ExampleWork.doWork path =" + filename + " appending text " + textToAppend);
BufferedWriter writer = new BufferedWriter(new FileWriter(filename, true));
writer.newLine();
writer.write(textToAppend);
writer.close();
} catch ( IOException e ) {
e.printStackTrace();
}
}
Schedule a job by using Android's JobScheduler java class. Using this class, Android can efficiently batch your job with other jobs that need network access. JobScheduler can request retries and when needed Android will rescheduled the work; the work is guaranteed. In the sample project JobServiceExample, the class ExampleJobScheduler illustrates scheduling. A unit of work is encapsulated by a java JobInfo class specifying the scheduling criteria. The JobInfo.Builder class is used to configure how the scheduled task should run.
public static void scheduleJob (Context context, int intervalinMS )
{
handleJob(context, intervalinMS );
}
private static void handleJob (Context context, long intervalinMS)
{
...
ComponentName serviceComponent =
new ComponentName( context, JobServiceExample.class );
...
JobScheduler jobScheduler = context.getSystemService( JobScheduler.class );
...
JobInfo.Builder builder = new JobInfo.Builder( JOB_ID, serviceComponent );
...
builder.setPeriodic( intervalinMS ); // job runs within the intervalinMS; API 21
builder.setPersisted( true ); // persist this job across device reboots; API 21
builder.setRequiredNetworkType( JobInfo.NETWORK_TYPE_ANY ); // API 21
builder.setRequiresDeviceIdle(false); // API 21
int result = jobScheduler.schedule( builder.build() );
String resultText = ( JobScheduler.RESULT_SUCCESS == result ) ?
"successfully" : "failed";
Log.i ( TAG, "ExampleJobScheduler.handleJob scheduled for intervalinMS of " +
intervalinMS + " is " + resultText );
...
}
QML
In this example app, the QML UI, main.qml, allows the user to schedule how frequently the task is executed.
...
Button {
text: qsTr("Apply")
anchors.horizontalCenter: parent.horizontalCenter
onClicked: Controller.scheduleJobService(scheduleModelId.
get(scheduleSelectorId.currentIndex).intervalMS)
}
...
Qt & C++
The FrontController C++ class exposes the job scheduling function to the QML interface.
Q_INVOKABLE void scheduleJobService(int intervalinMS);
...
void FrontController::scheduleJobService( int intervalinMS )
{
QAndroidJniObject::callStaticMethod
( "com/example/jobserviceexample/JobServiceExample","scheduleJobService",
"(Landroid/content/Context;I)V",
QtAndroid::androidActivity().object(), intervalinMS);
}
The Permissions C++ class is called when the application starts for check for and request of needed permissions.
void Permissions::requestExternalStoragePermission()
{
...
QtAndroid::PermissionResult request = QtAndroid::checkPermission(
"android.permission.WRITE_EXTERNAL_STORAGE" );
if ( request == QtAndroid::PermissionResult::Denied ) {
QtAndroid::requestPermissionsSync( QStringList() <<
"android.permission.WRITE_EXTERNAL_STORAGE" );
request = QtAndroid::checkPermission(
"android.permission.WRITE_EXTERNAL_STORAGE" );
if ( request == QtAndroid::PermissionResult::Denied ) {
mPermissionGranted = false;
if ( QtAndroid::shouldShowRequestPermissionRationale(
"android.permission.READ_EXTERNAL_STORAGE" ) ) {
QAndroidJniObject
( "com/example/jobserviceexample/ShowPermissionRationale",
"(Landroid/app/Activity;)V",
QtAndroid::androidActivity().object
QAndroidJniEnvironment env;
if ( env->ExceptionCheck() ) {
env->ExceptionClear();
}
}
} else {
mPermissionGranted = true;
}
} else {
mPermissionGranted = true;
}
...
}
The communication between the C++ Qt/QML and Java needs to be specified in main.cpp.
#include
#include "frontcontroller.h"
#include "permissions.hpp"
int main(int argc, char *argv[])
{
...
QQmlApplicationEngine engine;
FrontController frontController{app.parent()};
engine.rootContext()->setContextProperty( "Controller", &frontController );
const QUrl url(QStringLiteral("qrc:/main.qml"));
QObject::connect(&engine, &QQmlApplicationEngine::objectCreated,
&app, [url](QObject *obj, const QUrl &objUrl) {
if (!obj && url == objUrl)
QCoreApplication::exit(-1);
}, Qt::QueuedConnection); engine.load(url);
Permissions permissions;
permissions.requestExternalStoragePermission();
if ( permissions.getPermissionResult() ) {
qInfo( "Successfully obtained required permissions, app starting" );
return app.exec();
} else {
qWarning( "Failed to obtain required permissions, app terminating" );
}
}
Test it Out
Upon successfully building the app, run the JobServiceExample app and schedule a job by selecting the "Recording interval" and pressing "Apply". Quit the app. On Android, the file /storage/emulated/0/Download/JobServiceExampleLog.txt will be updated at the specified time interval. Upon rebooting the Android, you can observe, the file /storage/emulated/0/Download/JobServiceExampleLog.txt will continue to be updated at the specified time interval. The sample app, JobServiceExample, logs often to help you follow along.

Conclusion
To code a job scheduler in your QT Android application, there are many small steps, but this is true with all Android app development. Android job scheduling is a powerful, performant, robust feature that enables the Android OS to shoulder the burden of executing tasks based upon specific conditions. It's a nice tool to have in your toolbox.
↧
Lorn Potter: 'wasm memory too small' Qt for WebAssembly
Sometimes when I am building a larger project with Qt for WebAssembly, I get this type of message:
wasm-ld: error: initial memory too small, 17553264 bytes neededand the build fails.
This means that you need to tell Emscripten compiler to allocate more than the standard 1GB initial memory.
Qt allows you to specify to add more initial memory by using QMAKE_TOTAL_MEMORY in your pro file.
So it makes sense to add something like this:
QMAKE_TOTAL_MEMORY=17553264
BUT the result is:
shared:ERROR: For wasm, TOTAL_MEMORY must be a multiple of 64KB, was 17553264grrrr... ok, what if we find a multiple of 64?
17553264 / 64 = 274,269.95
We need a whole number, so lets round up to the next whole number.
274270 * 64 = 17553280
But no. That doesn't work either:
shared:ERROR: For wasm, TOTAL_MEMORY must be a multiple of 64KB, was 17553280WTH?!?
The answer is that a KB is 1024 bytes, so 64 * 1024 = 65536 bytes
So let's find the closest whole number multiple of 64 KB (65536)
17553264 / 65536 = 267.841...
so let's try 268
268 * 65536 = 17563648
QMAKE_TOTAL_MEMORY=17563648and this now builds, and hopefully runs!
- You can also read more about Mobile and Embedded development and Qt for WebAssembly in the book Hands-On Mobile and Embedded Development with Qt 5
↧
↧
Francesc M. Qt Blog: Non closable QDialog
This is quite beginner post but I believe it’s good to share what we learn through experience with the people that are starting. In this entry I’ll show you how to have a UI non closable QDialog but that it can be close from the code.
In GitQlient I’m using this dialog to inform the user that the repository is being loaded. There is some data I’m loading in the cache/background (branches, tags, etc) that can take a bit if the repository is massive. In my case, I’m working with some repos that are quite big (~10 Gb only text files) and old. People usually forget to remove their branches and right know I can see around 2000 branches and close to 500 tags. In that case an async load is needed so the user has to wait.
How to do a non closable QDialog?
We want to prevent the user to close the dialog in all it’s forms:
- Disabling the window close icon.
- Disabling the Esc key that in QDialog closes/cancels the dialog.
Acting on the windows title
The way to do that is quite simple. In the first place we hide the close button:
setWindowFlags(windowFlags() & ~Qt::WindowCloseButtonHint);This will make the close button gone and keep the resize behaviour and dialog title. If you want a dialog only for the text you can do:
setWindowFlags(Qt::FramelessWindowHint);
That will remove the title bar and all it’s components.
Method 1: Acting on the Esc key event
QDialog process the Esc key as close/cancel. Since we don’t want that the user closes our dialog, we need to take care of that behaviour. To do that we need to capture the key press event and avoid processing it:
void WaitingDlg::keyPressEvent(QKeyEvent *e)
{
   if (e->key() == Qt::Key_Escape)
      return;

   QDialog::keyPressEvent(e);
}
The code is quite simple, we check the pressed key and if it’s the one we’re expecting, we don’t process the event.
Additionally, it’s also useful to have full control of another event: the closeEvent. That method plus a custom close method will give us the full behaviour:
void WaitingDlg::closeEvent(QCloseEvent *e)
{
   if (!mPrepareToClose)
      e->ignore();
   else
      QDialog::closeEvent(e);
}

void WaitingDlg::close()
{
   mPrepareToClose = true;

   QDialog::close();
}
In this code I’m using a class member to store when I do want to close the dialog, preventing the dialog to close if it wasn’t me how said it. The result is that this dialog can only be close by calling the close() method.
Method 2: Override reject method
Suggested in the comments by NickD2039 another possibility is to override the reject method, that would prevent the end user from closing the dialog. The code posted has a closeNow method that acts in a similar way to the method 1, it activates a control variable that finall calls accept.
I kind of like a bit more this code, since it’s a bit more elegant and requires you to write less code:
void closeNow()
{
   mPrepareToClose = true;
   accept();
   mPrepareToClose = false;
}

void accept()
{
   if (mPrepareToClose)
      QDialog::accept();
}

void reject()
{
   if (mPrepareToClose)
      QDialog::reject();
}
Where to find the source coude?
You can find the source code for the non closable dialog in my GitHub repository for Qt tips. Please noticed that I name it WaitingDlg since I did the code for GitQlient and that was its purpose.
Non closable QDialog first appeared on My C++ & Qt blog - Cesc M..
↧
The Qt Company Blog: Creating an Embedded Qt Quick Application in Visual Studio (2/2)

In part 1 of this post we showed how to create a multi-platform Qt Quick application project in Visual Studio targeting Windows and Embedded Linux. We will now show how to run the application on an embedded device. We will then continue developing the project into the full embedded application that we set out to create. Finally, we will use the VS debugger to remotely debug the application's C++ and QML code.

↧
KDAB on Qt: Hotspot Version 1.3.0 Released
We are pleased to announce a new release of our Hotspot Linux perf performance analysis GUI, Hotspot version 1.3.0!
Hotspot is a replacement for perf reportthat takes a perf.data file, parses and evaluates its contents, and then displays the result in a graphical form. You can read a bit more about Hotspot here: https://www.kdab.com/hotspot-gui-linux-perf-profiler/
Overview of New Features and Improvements
With this new release, Hotspot has become much faster at interpreting data for large, complex applications; analyzing perf.data files for firefox,e.g. with its monster libxul, is now magnitudes faster than it was in the previous releases of Hotspot.
On top of that, we now properly support analysis of zstd compressed data files, for example, those obtained via perf record -z. This support feature easily reduces the size of the perf.data files by one to two orders of magnitude.
The timeline has been improved and now shows tick marks on the time axes, as well as smart time unit prefixes when zoomed in:


You can view the original request for this feature here: https://github.com/KDAB/hotspot/pull/238
Additionally, hotspot can now demangle rustc symbols:

You can view the original request for this feature here: https://github.com/KDAB/hotspot/issues/239
Finally, we’ve updated the perfparser submodule with a plethora of fixes and improvements. Better support for fork-based parallelism is among the numerous improvements that we’ve made.
How can you get the new release?
You can download Hotspot version 1.3.0 from KDAB’s GitHub at this link, where you can also find the list of fixes in this version: https://github.com/KDAB/hotspot/releases/tag/v1.3.0
Try it out and let us know what you think! Please report issues on GitHub, but we are also open to any kind of feedback through the comment field below. If you want to learn more about perf and hotspot, also consider attending one of our Linux specific profiling and debugging training classes.
About KDAB
If you like this blog and want to read similar articles, consider subscribing via our RSS feed.
Subscribe to KDAB TV for similar informative short video content.
KDAB provides market leading software consulting and development services and training in Qt, C++ and 3D/OpenGL. Contact us.
The post Hotspot Version 1.3.0 Released appeared first on KDAB.
↧
KDAB on Qt: Heaptrack Version 1.2.0 Released
We have just released version 1.2.0 of Heaptrack, the fast heap memory profiler for C++/Linux applications.
A bit of Background
![]() The Heaptrack fast heap memory profiler allows you to track all heap memory allocations at run-time. Afterwards, you can use the accompanying GUI tool to find optimization opportunities in your code by analyzing the recorded profiling data.
The Heaptrack fast heap memory profiler allows you to track all heap memory allocations at run-time. Afterwards, you can use the accompanying GUI tool to find optimization opportunities in your code by analyzing the recorded profiling data.
If you’d like to read a bit more about Heaptrack, you can do so here.
Overview of 1.2.0 Release
The Heaptrack version 1.2.0 release is a maintenance release and brings a couple of important bug fixes and improvements. As a result of these bugfixes and improvements, Heaptrack is more stable and error resistant while recording data.
Additionally, due to some minor tweaks to the graphical analysis tool, it is more efficient to use. You’ll find that the performance of the analysis step is slightly improved too.
Finally, an important bug in the data-diffing algorithm is fixed, which should make that feature more useful again.
You can find a list of the commits that went into this release here.

How to get it?
You can download sources for Heaptrack from the KDE mirrors. Alternatively, wait for your distribution to pick up this release and then it will provide a binary package for you to install.
If you need help with using Heaptrack, or with performance tooling in general, do note that we also offer a training course on debugging and profiling Qt applications. KDAB also offers on-site workshops and mentoring to aid you in optimizing your C++ application performance. I’ll gladly teach you how to use Heaptrack effectively!
About KDAB
If you like this blog and want to read similar articles, consider subscribing via our RSS feed.
Subscribe to KDAB TV for similar informative short video content.
KDAB provides market leading software consulting and development services and training in Qt, C++ and 3D/OpenGL. Contact us.
The post Heaptrack Version 1.2.0 Released appeared first on KDAB.
↧
↧
KDAB on Qt: KDE’s Akademy 2020 – A Quick Summary
What is Akademy?
Akademy is the yearly conference for the KDE community, which is a community devoted to creating free software for desktop and mobile. Typically, Akademy takes place in a different city each year. However, due to the pandemic, the conference was online this time around. September 4-11 marked the dates of Akademy 2020.
KDAB and KDE
KDAB and KDE have a very close relationship. Around 40% of KDAB employees are or have been KDE contributors. In fact, some have been contributing for more than a decade. So, KDAB has been sponsoring KDE’s Akademy for quite a while.
Overview of Akademy 2020
The first day of the conference, September 4, included a full day of training sessions for KDE contributors. KDAB taught 4 of the 6 training sessions: UI/UX Design in QML for Desktop, Debugging & Profiling on Linux, Introduction to QML, and Multithreading in Qt. These were reduced, half-day versions of our popular training offerings.
Throughout the weekend, the conference brought forth several talks. These covered topics such as QML, static analysis, Qt on Android, licensing, and even how to write better software for dentists and hospitals.
Most of the weekdays featured more work-focused meetings, involving round-table discussion. In addition to that, we managed to have time for community-building activities, like escape rooms and a quiz.
Finally, on the last day of the week, the talk schedule returned with important topics. A couple of the topics the talks covered on this day were maintaining a good work/life balance and knowledge retention within the organization when contributions cease, for instance.
Praise for KDE
To conclude, we want to congratulate KDE for such a successful conference and thank them for the help they offered us with organizing Qt Desktop Days (which happened at the same time of KDE’s Akademy, from September 7-11). Thank you, KDE! Keep up the excellent work!

About KDAB
If you like this blog and want to read similar articles, consider subscribing via our RSS feed.
Subscribe to KDAB TV for similar informative short video content.
KDAB provides market leading software consulting and development services and training in Qt, C++ and 3D/OpenGL. Contact us.
The post KDE’s Akademy 2020 – A Quick Summary appeared first on KDAB.
↧
KDAB on Qt: How to Build C++ Projects with the Address Sanitizer on Windows
Memory bugs are tricky. Leaks have a clear impact on performance, and quickly become hard to spot when heap allocated objects move too much. Memory access bugs, on the other hand, make your program crash right away, if you’re lucky. In less desirable cases, they may end up corrupting random objects on the heap, and only end up in a crash much later. Or even worse, leading to undetected undefined behaviours or wrong computations.
This is the reason why there are a number of standalone tools (e.g. valgrind, Dr.Memory), as well as compiler extensions (e.g. AddressSanitizer, MemorySanitizer, LeakSanitizer) to help with memory bug detection.
On Windows, and especially using Qt, things are a bit harder, as valgrind is not an option and Dr.Memory often crashes with Qt applications. Unless you use WSL, this only leaves compiler tools on the table.
Memory Sanitizers on Windows
First of all, what are our choices when it comes to using memory sanitizers on Windows?
There are two options:
- with Visual Studio’s cl compiler
- VS2019 v16.4 and above– x86/Release builds only (experimental) – AddressSanitizer only
- VS2019 v16.7 and above {x86,amd64}/{Release,Debug} builds – AddressSanitizer only
- with LLVM’s clang/clang-cl compilers (also available through Visual Studio)
- {x86,amd64}/Release builds only – AddressSanitizer only
So using AddressSanitizer (from now on ASAN) is the only viable option for memory bug detection with memory sanitizers on Windows. Also, since the support for the cl compiler is still incomplete, in this post we will be using clang.
Furthermore, we will be using Visual Studios’s bundled clang to make it possible to generate Visual Studio solutions. If you’re using your own clang installation, you should update the following paths accordingly. You can find Visual Studio 2019’s clang in the following directories:
- For x86:
%ProgramFiles(x86)%\Microsoft Visual Studio\2019\Professional\VC\Tools\Llvm\bin - For x64:
%ProgramFiles(x86)%\Microsoft Visual Studio\2019\Professional\VC\Tools\Llvm\x64\bin
Note that you will need to add the right directory manually to the PATH when using the command line, as there is no vcvars script available for clang tools.
From now on I’m going to assume for all paths that we’re using Visual Studio 2019 Professional and we’re building 64 bit applications.
Compile an executable with the static C++ runtime (/MT)
If you build and link in one go, it is enough to compile with -fsanitize=address
clang-cl -fsanitize=address main.cpp
When doing compilation and linking in separate steps, we need an extra step to provide the ASAN runtime explicitly.
clang-cl -fsanitize=address -c main.cpp -o main.o
# Call vcvars64 here so lld-link will be able to link all the default libraries
lld-link main.o -libpath:"%ProgramFiles(x86)%\Microsoft Visual Studio\2019\Professional\VC\Tools\Llvm\x64\lib\clang\10.0.0\lib\windows" ^
    -wholearchive:clang_rt.asan-x86_64.lib -wholearchive:clang_rt.asan_cxx-x86_64.lib
The linker will implicitly link the program against the static CRT (/MT) and with the static version of clang’s ASAN runtime. Note the use of -wholearchive to force the compiler to include all the symbols from the library, avoiding optimizations.
If the program consumes a library which is also being sanitized, then said library (which should be linked against the dynamic CRT with /MD) should be linked against clang_rt.asan_dll_thunk-x86_64.lib. In this way, the library (or libraries) will use the shadow memory of the statically linked ASAN runtime in the executable.
Compile an executable with the dynamic C++ runtime (/MD)
Again, it is easy to compile and link in one go:
clang-cl -fsanitize=address /MD main.cpp
But now the executable should use a different ASAN runtime when linked:
clang-cl -fsanitize=address -c main.cpp -o main.o
# Call vcvars64 here so all the default libraries are added to lld-link
lld-link main.o -libpath:"%ProgramFiles(x86)%\Microsoft Visual Studio\2019\Professional\VC\Tools\Llvm\x64\lib\clang\10.0.0\lib\windows" ^
    clang_rt.asan_dynamic-x86_64.lib -wholearchive:clang_rt.asan_dynamic_runtime_thunk-x86_64.lib
Note that only clang_rt.asan_dynamic_runtime_thunk-x86_64.lib needs the -wholearchive flag here.
All the included dlls that are also sanitized (which should always be using the dynamic CRT) should be linked against the same ASAN runtime libraries as the executable.
Since clang_rt.asan_dynamic-x86_64.lib is an import lib pointing to clang_rt.asan_dynamic-x86_64.dll, when running a sanitized executable (or loading a sanitized lib) its folder should be in the PATH. You can find the dll alongside the .lib in %ProgramFiles(x86)%\Microsoft Visual Studio\2019\Professional\VC\Tools\Llvm\x64\lib\clang\10.0.0\lib\windows.
Using ASAN with CMake
If you want to use ninja or any other generator other than Visual Studio, just point CMake to your clang-cl installation and add the necessary flags to your targets. Adjust your flags for plain clang if you don’t need or don’t care about clang-cl.
add_executable(exec main.cpp)
target_compile_options(exec PRIVATE -fsanitize=address) # /MD will be used implicitly
target_link_directories(exec PRIVATE "${ENV:PROGRAMFILES(X86)}/Microsoft Visual Studio/2019/Professional/VC/Tools/Llvm/x64/lib/clang/10.0.0/lib/windows")
target_link_libraries(exec PRIVATE clang_rt.asan_dynamic-x86_64 clang_rt.asan_dynamic_runtime_thunk-x86_64)
target_link_options(exec PRIVATE /wholearchive:clang_rt.asan_dynamic_runtime_thunk-x86_64.lib)
CMake will always need to be invoked with -DCMAKE_BUILD_TYPE=Release otherwise the compilation will fail.
To generate a Visual Studio solution, you need to pass a few extra arguments to CMake:
- Generate a Visual Studio solution:
-G "Visual Studio 16 2019" - Choose between 32 or 64 bit target:
-A {Win32,x64} - Use the clang toolkit:
-T ClangCL
Or, if you are using Visual Studio Code just select the right entry from the kit list (e.g. Clang 10.0.0 for MSVC with Visual Studio Professional 2019 Release (amd64)).
Conclusions
Using tools to track down memory bugs helps saving time and effort, especially on complex projects. On Windows, the available tooling is limited, and a step by step documentation on how to use what’s available may be hard to come by. With this blog post, it will be hopefully easier for you to leverage the AddressSanitizer on Windows and keep memory bugs in your projects under control.
If you’d like to learn more about the tooling available for C++ developers working with Microsoft Windows on the desktop, you might be interested in our Debugging and Profiling C++ Applications on Windows training.
About KDAB
If you like this blog and want to read similar articles, consider subscribing via our RSS feed.
Subscribe to KDAB TV for similar informative short video content.
KDAB provides market leading software consulting and development services and training in Qt, C++ and 3D/OpenGL. Contact us.
The post How to Build C++ Projects with the Address Sanitizer on Windows appeared first on KDAB.
↧
KDAB on Qt: GammaRay 2.11.2 released
![]() GammaRay 2.11.2
GammaRay 2.11.2
 GammaRay 2.11.2
We have released version 2.11.2 of our Qt application introspection tool GammaRay, bringing support for Qt 5.15 and improved Qt Quick item picking.
GammaRay is a software introspection tool for Qt applications developed by KDAB. Leveraging the QObject introspection mechanism it allows you to observe and manipulate your application at runtime. This works both locally on your workstation and remotely on an embedded target.
GammaRay is available as part of the Qt Automotive Suite including QtCreator integration and professional support, in the Qt Market Place, or GPL-licensed on Github.
GammaRay Tutorials
Another important update you may have missed is that we now offer short, highly informative tutorials to help you get the best out of GammaRay.
GammaRay Tutorials (Part 1) – GammaRay Introduction
What can GammaRay do for us? This video shows GammaRay in action, introducing the main aspects of its user interface. To understand the benefits of a tool like GammaRay, we are going to show you how it ca…
14 0
GammaRay Tutorials (Part 1) – GammaRay Introduction
GammaRay Tutorials (Part 2) – How to set up GammaRay on Windows
GammaRay™ is distributed in source form; you can freely download it from https://www.kdab.com/development-resources/qt-tools/gammaray/.
Of course, the first thing w…
11 11
GammaRay Tutorials (Part 2) – How to set up GammaRay on Windows
GammaRay Tutorials (Part 3) – Add Gammaray Shortcut in Qt Creator
When facing a problem in a Qt application it is very convenient to be able to quickly launch a debugger and try to understand what is going wrong. You can say the same about GammaRay – it is extremely adv…
6 1
GammaRay Tutorials (Part 3) – Add Gammaray Shortcut in Qt Creator
GammaRay Tutorials (Part 4) – Launch an Application Under GammaRay
How does GammaRay inspect a Qt application, exactly? The answer is that there are multiple ways for GammaRay to inject itself in a Qt application. It depends on whether or not the application is already r…
6 1
GammaRay Tutorials (Part 4) – Launch an Application Under GammaRay
GammaRay Tutorials (Part 5) – Why isn’t my QtQuick Element visible
One of the most important inspectors available in GammaRay is the Qt Quick Scenes inspector. It allows you to visualize the object tree of a QML scene, the visual positioning of the items, and much mo…
4 0
GammaRay Tutorials (Part 5) – Why isn’t my QtQuick Element visible
GammaRay Tutorials (Part 6) – GammaRay Quick Scenes Introduction
Let’s explore GammaRay’s Qt Quick Scenes inspector in more detail. In this video, we are going to explain some of the many tools available when debugging a QML/Qt Quick application, for instance how t…
3 0
GammaRay Tutorials (Part 6) – GammaRay Quick Scenes Introduction
GammaRay supports Linux, OSX and Windows users.
Find out more on our GammaRay home page.
About KDAB
If you like this blog and want to read similar articles, consider subscribing via our RSS feed.
Subscribe to KDAB TV for similar informative short video content.
KDAB provides market leading software consulting and development services and training in Qt, C++ and 3D/OpenGL. Contact us.
The post GammaRay 2.11.2 released appeared first on KDAB.
↧
KDAB on Qt: KDDockWidgets 1.0 has been released!
↧
↧
KDAB on Qt: Qt Desktop Days 7-11 September
 We are happy to let you know that the very first edition of Qt Desktop Days 2020 was a great success! Having pulled together the event at very short notice, we were delighted at the enthusiastic response from contributors and attendees alike.
Over 500 registered attendees could enjoy five days of technical talks. The program shows the range and depth of offerings that kept people coming back.
Presentations
We started off the event week with an introduction from Kalle Dalheimer, KDAB’s CEO, followed by a Keynote on Qt 6 for the desktop from Giuseppe D’Angelo, an Approver of the Qt Project and a software engineer at KDAB. You can see this session already on our KDAB TV channel, here.

After that, there was a series of varied topics that roughly fit into three tracks: QML, Testing and Widgets.
A lot of attention was given to QML, ranging from how you migrate from widgets to QML, to showcasing QML or showcasing part of the QML design framework. There were two very interesting presentations about testing: one on behavior-driven testing and another on code coverage and how you drive your testing effort there, presented by our long time partner froglogic. We were introduced to KDDockWidgets, an advanced docking framework and a presentation from Bluescape showing how to add touch and pen input to an application.
Two standalone sessions that come to mind were a fascinating account of the history of Qt and VLC (you likely know it best as Youtube) and a very interesting session from Microsoft presenting their Windows Subsystem for Linux, which included information on the new Windows insider program. More on all of that in the upcoming recordings…
The whole show ended with a Q&A session, where the audience could ask questions to a number of people on anything relating to Qt. Lots of very good and interesting questions, both for where we are today and what’s going to be in the future.
Talk Recordings
For those of you who missed the presentations this year – Stay tuned! We did record them all and will put them on YouTube as soon as we’re done with the post-production. Subscribe to our YouTube channel, and you’ll be the first to know when they’re out there.
A big thank you to everyone involved. We really couldn’t have done it without you. Hope to see you all at Qt Desktop Days 2021!
![]()
The post Qt Desktop Days 7-11 September appeared first on KDAB.
↧
KDAB on Qt: Full Stack Tracing Part 1
Full stack tracing is a tool that should be part of every software engineer’s toolkit. It’s the best way to investigate and solve certain classes of hard problems in optimization and debugging. Because of the power and capability it gives the developer, we’ll be writing a series of blogs about it: when to use it, how to get it set up, how to create traces, and how to interpret results. Our goal is to get you capable enough to use full stack tracing to solve your tough problems too.
Firstly, what is it? Full stack tracing is tracing on the full software stack, from the operating system to the application. By collecting profiling information (timing, process, caller, API, and other info) from the kernel, drivers, software frameworks, application, and JavaScript environments, you’re able to see exactly how the individual components of a system are interacting. That opens up areas of investigation that are impossible to achieve with standard application profilers, kernel debug messages, or even strategically inserted printf() commands. One way to think of full stack tracing is like a developer’s MRI machine that allows you to look into a running system without disturbing it to determine what is happening inside. (And unlike other low-level traces that we’ve written about before, full stack tracing provides a simpler way to view activity up and down the entire software stack.)
Use cases
When do you need full stack tracing? Since it gives you visibility across a running system, it’s a great solution anytime you need to do things like:
- Gain visibility into the software running below the level of your application and API calls
- Measure timing and synchronization of events that happen across multiple applications
- Optimize application startup time, locating startup script inefficiencies, and trimming down system boot time
- Verify communication between a client and server process, or any other process pairs like publisher and subscriber, or application and watchdog
- Detect background processes that interfere with an application
- Pinpoint places in the system that consume excessive CPU cycles
- Find problematic interactions between multiple device drivers or independently running software stacks
- Correctly understand the behavior of a complex system before you make bug fixes or alterations
Battling slow boot time
To put all of this in context, let’s walk through an example where we used full stack tracing to solve a show-stopping problem for a client. In this case, it was an automotive customer creating an infotainment system with a rather complex software stack. The main application was created in Qt and ran on a Nvidia Tegra X1, which is an extremely powerful processor for an embedded system. The GPU rivals that of laptops with a quad core CPU. Because the software required integration from many partners, developers unfortunately realized very late during integration that despite all of the power, the infotainment system was taking over five seconds to show the application’s first screen. This was completely unacceptable, and we were asked to diagnose why it was taking so long.
As much of the application was in QML, we first took a look at the code. While it certainly wasn’t crafted for speed – and they probably used far too much JavaScript code – this didn’t seem like the primary problem. We needed to determine if the boot issues were due to an overall sluggishness with too many pieces of software running, or if we could pinpoint the problems to one (or several) specific areas. Firing up the QML profiler highlighted something we didn’t expect: a trivial binding evaluation of a string to an image file in early startup took 180 milliseconds. What was happening underneath it that caused that binding to take so long?

QML profiler showing long binding in action (similar issue, different app)
That’s a question that the QML profiler can’t answer. While you can make many educated guesses to figure out exactly what’s happening, it is this type of problem where full stack tracing is invaluable. It can tell you what Qt, C++, kernel, driver, or hardware interactions are happening underneath the QML so you can see where the time is being spent.
By turning on full stack tracing for the kernel, syscalls, and C++, adding tracepoints within Qt, and rerunning the application, we were able to find that those long bindings were occurring because many libraries were being loaded for image plug-in formats. Since the application only used PNG files, we were able to eliminate a huge number of these unnecessary loads for other file plug-ins. That included the SVG plugin, which was especially heavy. Although the application was a Qt Quick app that didn’t use Qt Widgets, the SVG plugin was pulling in the relatively big Qt Widgets library, which was unneeded. (This is because the plugin was compiled with QtWidgets support enabled.) But while eliminating the plug-ins made a dramatic improvement, it still wasn’t fast enough, and it was taking far longer to boot than it should.
Again, full stack tracing was able to show us that the disk I/O was a huge culprit and many applications were hammering the disk during startup. However, most of those applications accessing the disk were background tasks that weren’t critical to the startup procedure. Furthermore, most of the disk I/O was coming through a single call within syslog: the processes were emitting reams of debug output, going through syslog to write the data out to the flash drive. The CPU and GPU had more than enough horsepower to manage this, but the on-board flash was really cheap…and pretty slow.
While it might have been better to remove unnecessary logging from those background tasks, that change would have required a lot of coordination and testing because many distinct software suppliers were involved. That would have introduced a good deal of risk to a project that was already perilously close to the production deadline. Instead, we settled for bumping up the main application’s priority. The increased priority let the GUI beat out those background tasks during boot up. The background tasks were able to harmlessly finish their work slightly later. This change was now able to bring the splash screen up within one second, meeting the customer requirements to everyone’s great relief.
While full stack tracing was critical to the technical understanding of the problem, it was also necessary for the project management. With the high pressure of the impending deadline, engineers had to convincingly explain that the corrective actions being taken had a high degree of probable success. Full stack tracing indicated precisely what the problems were and exactly where in the software stack they were, avoiding any finger-pointing between suppliers.

QML binding shown with full stack tracing, highlighting SDA activity (similar issue, different app)
Until next time
Hopefully you’ll agree that full stack tracing could be a valuable skill to add to your repertoire. Stay tuned – our next blog will show you how to get it set up.
If you’d like to learn more about Debugging and Profiling, you might be interested in one of our training classes. Visit this page to find out some of the areas and correlating tools with which we are used to working, and with which we can help you.
About KDAB
If you like this blog and want to read similar articles, consider subscribing via our RSS feed.
Subscribe to KDAB TV for similar informative short video content.
KDAB provides market leading software consulting and development services and training in Qt, C++ and 3D/OpenGL. Contact us.
The post Full Stack Tracing Part 1 appeared first on KDAB.
↧
The Qt Company Blog: QList changes in Qt 6
With Qt 6, changes are coming to many components. Containers are no exception. In this blog post I tried to capture the most significant changes to QList and related classes.

↧