Quantcast
Channel: Planet Qt
Viewing all 15410 articles
Browse latest View live

V-Play Engine: Release 3.5.0: Run your Qt and Felgo Apps in the Browser with WebAssembly (WASM)

$
0
0

Felgo 3.5.0 adds support for WebAssembly (WASM). This allows you to use Felgo and Qt to build applications that also run in the browser. With this update you get access to a new target platform, with the same source code and skills you already used to develop mobile, desktop and embedded apps with Felgo and Qt.

Felgo for WebAssembly helps you to streamline your development process, and maintain a single universal code-base for all your deployment targets, including the web.

With Felgo for WebAssembly you can put production-ready Felgo and Qt apps to the web! The official Qt for WebAssembly port still suffers from several issues that we fixed for you, you can find more details further below.

What is WebAssembly?

WebAssembly is a new type of code that can be run in modern web browsers — it is a low-level assembly-like language with a compact binary format that runs with near-native performance and provides languages such as C++ the ability to run on the web. It is also designed to run alongside JavaScript, allowing both to work together.

WebAssembly support in browsers is evolving rapidly. It is being developed as a web standard via the W3C.

Qt for WebAssembly (WASM) is a platform plugin that allows execution of Qt apps on any compatible browser. The most common Qt and QML components are available and apps require little or no changes to the source code to be able to run in the browser.

With Felgo for WebAssembly, you get an improved version of the Qt WASM port, with several fixes and additional features. You can find a detailed list of the improvements later in this post. You can also use Felgo for WebAssembly with plain Qt applications, that do not include any Felgo components, to benefit from the improvements.

Wonder how Felgo for WebAssembly looks like? Here is an example:

Use Cases for Web Apps using WebAssembly

Port Existing Applications to the Web

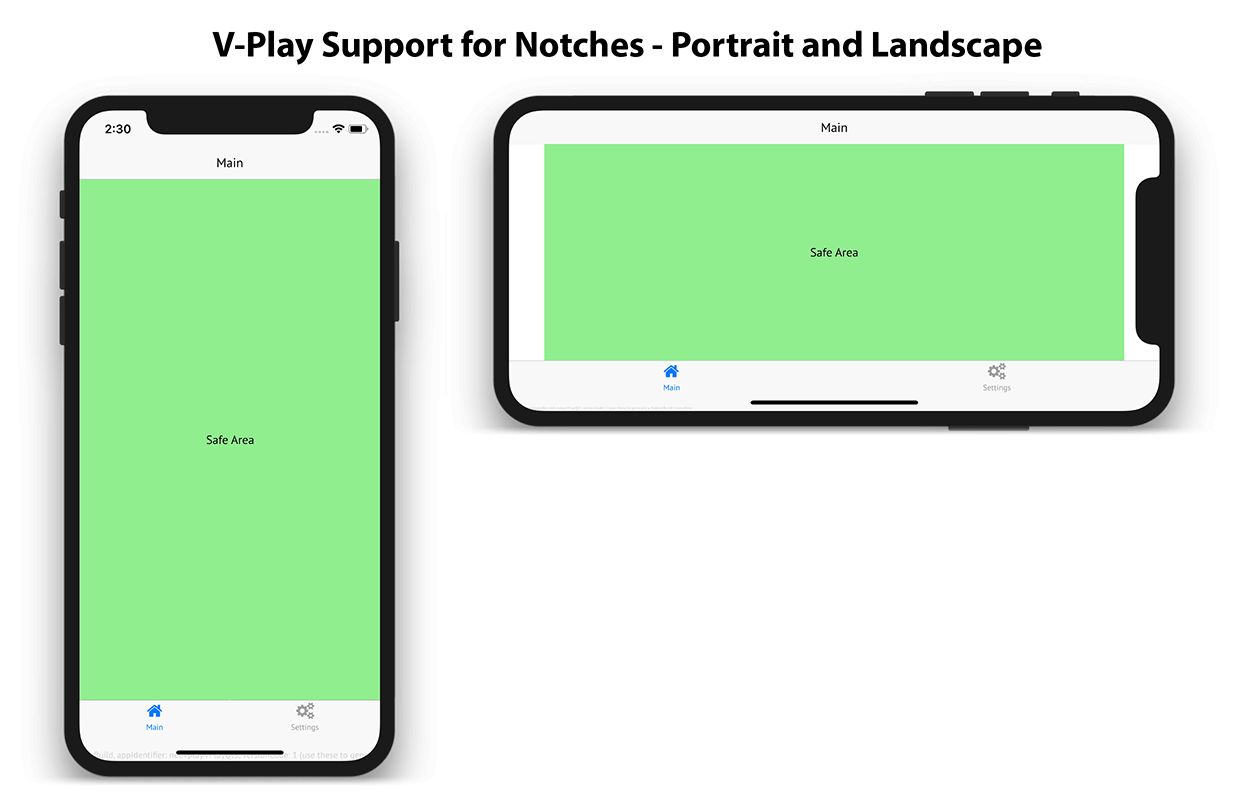
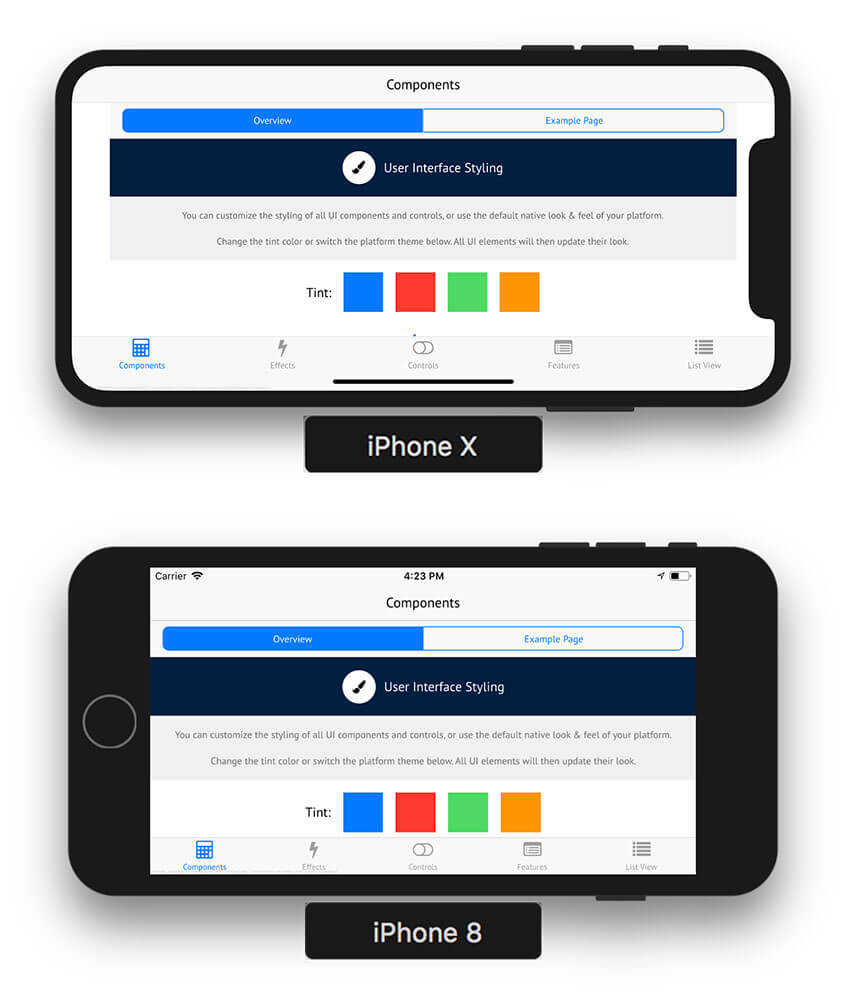
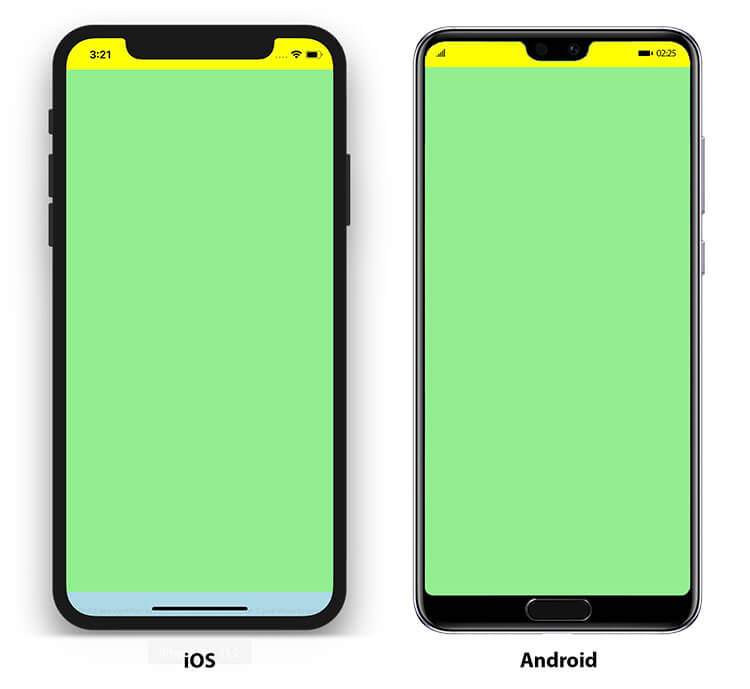
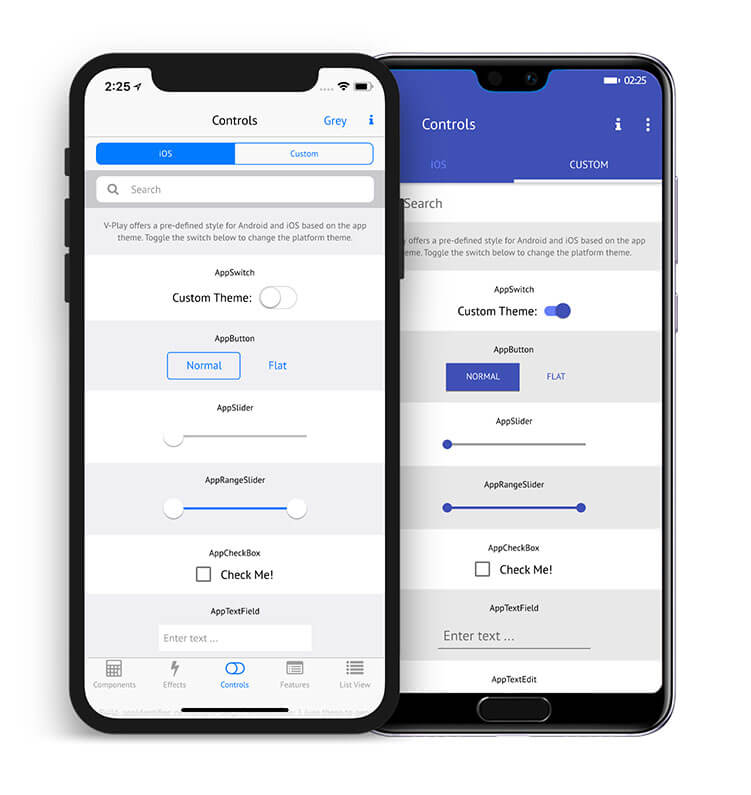
You can provide your existing Qt and Felgo applications also on the web, inside a browser, to reach a wider audience. With WebAssembly, this is possible without additional development effort. With Felgo you can share the same code-base for your mobile, desktop or embedded app as well. The UI/UX will automatically adapt to the platform.

Zero-Installation Experience

Getting people to install an app is actually a pretty significant obstacle to adoption. Now you can provide a zero-installation experience for your application, by serving it via the browser. Nothing is easier than just visiting a website with your browser.

Reuse Your Existing Skills

Now you can develop web applications with beautiful animated UIs, with your existing Felgo, Qt and QML knowledge.

Graphically Demanding or Computationally Heavy Applications

WebAssembly is also a perfect fit for applications that demand a lot of resources or performance. WASM is faster than JS for computationally or graphically demanding applications.

Integrate WASM Into Existing Websites

WebAssembly is rendered to a HTML element. You can freely integrate it into any existing website or other web applications. WASM apps can also communicate with JS in both directions. Examples for this will follow soon.

Benefits of using WebAssembly to Develop Web Apps

Code Reuse & Portability

With the same code-base, you are now able to deploy your applications to mobile, desktop, embedded and the web. This can save tremendous amounts of time for developing and maintaining an additional platform.

Reduced Time to Market

There are several factors that lower the time to market using WebAssembly. Obviously reusing a universal code-base for all platforms is one of them. This also leads to heavily reduced testing times, as most bugs will be shared across all platforms and only need to be fixed once for all of them.

Compared to e.g. mobile applications, with store reviews taking several days and tight store guidelines that have to be met, a web app also allows shorter release cycles. You can quickly test and publish new features of your application.

Rights Protection

WebAssembly UI is rendered in a Canvas HTML element, users/extensions can not modify the content of the resulting UI, as well as protecting the assets and application logic.

Web crawlers/scrapers can not parse the UI rendered in the canvas, further protecting the information provided using WebAssembly.

Improvements of Felgo WASM compared to Qt WASM

Since Qt announced support for WebAssembly to enable Qt applications to run on the Web, we were closely following the progress. There are a couple of crucial fixes and additions that needed to be performed to use WebAssembly with Qt in production. Here is a quick overview of the most important improvements available with Felgo for WebAssembly:

Test more WebAssembly Examples

You can check out a couple of Felgo examples using WebAssembly right in your browser.

Test more Examples

How to Use Felgo for WebAssembly

Use QML Hot Reload with WebAssembly during Development

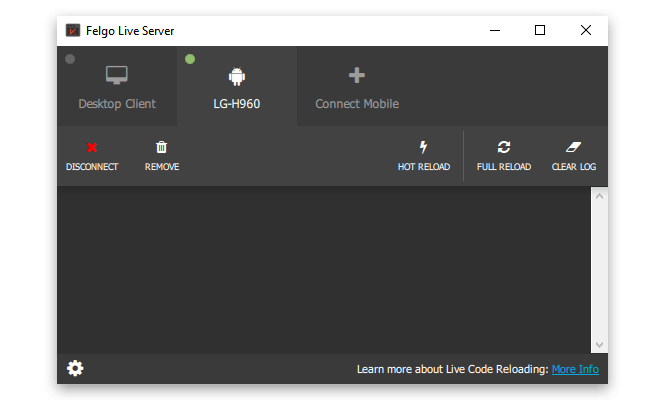
During development, you can use QML Hot Reloading also with WebAssembly. You can start the pre-built Web Live Client hosted by Felgo right from your Felgo Live Server.

The WASM Live Client will open in your browser and immediately connect to your Live Server using a localhost connection. Your source code will not leave your local network, not even your computer actually.

Build and Deploy your App with WebAssembly

You can find a detailed step-by-step guide on how you can build and deploy your application with Felgo for WebAssembly in the documentation.

Here are the most important steps as a quick overview.

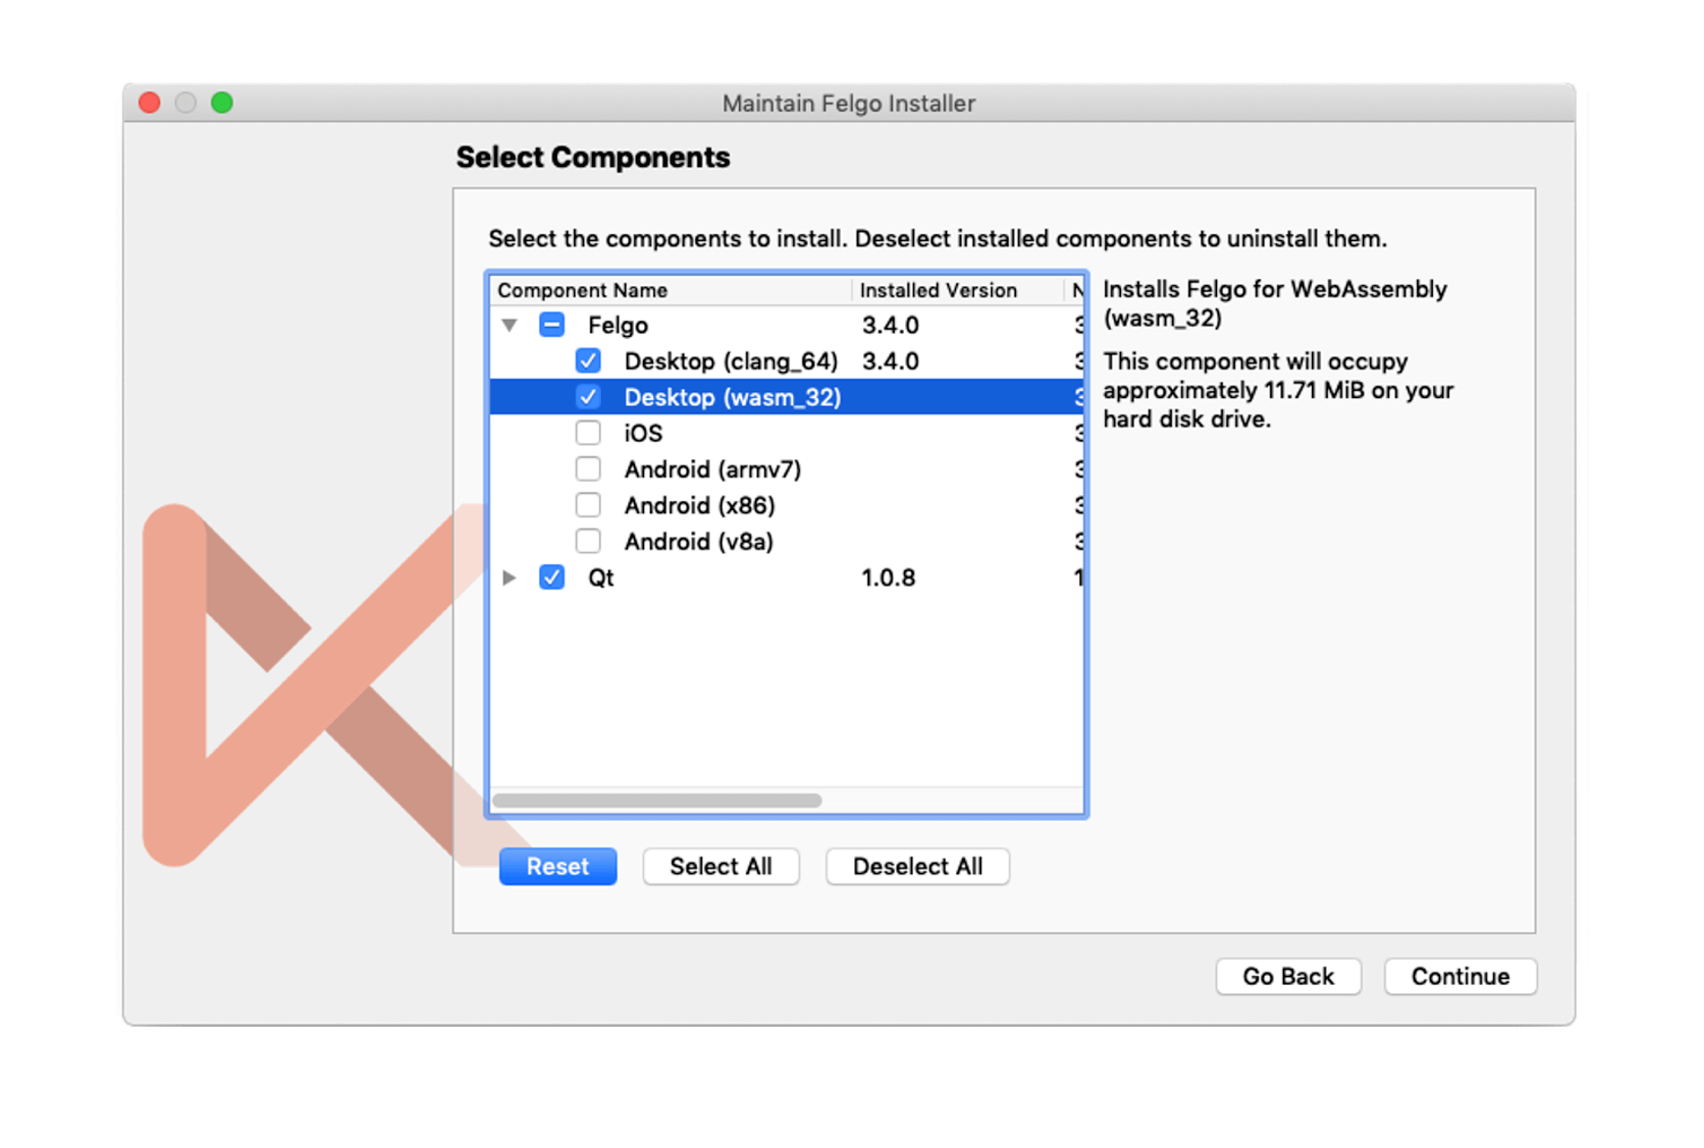
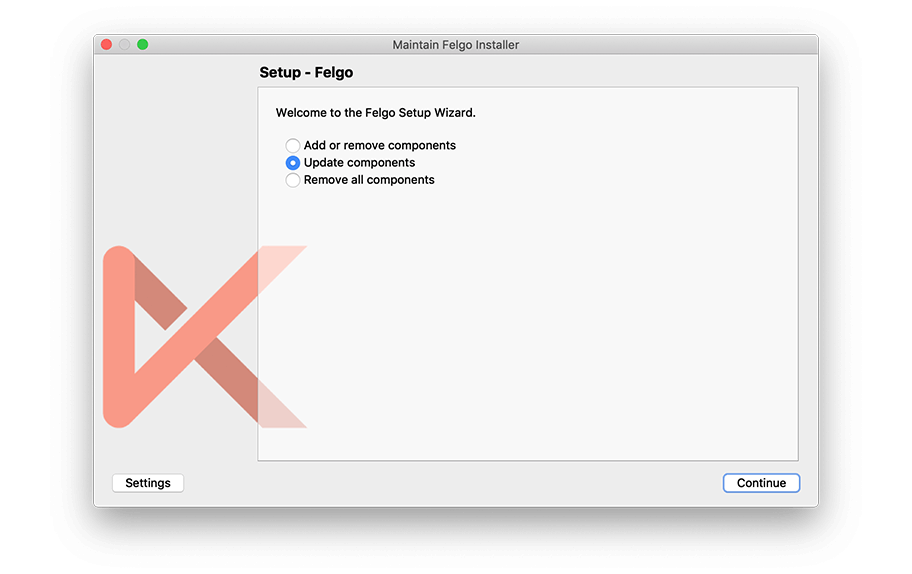
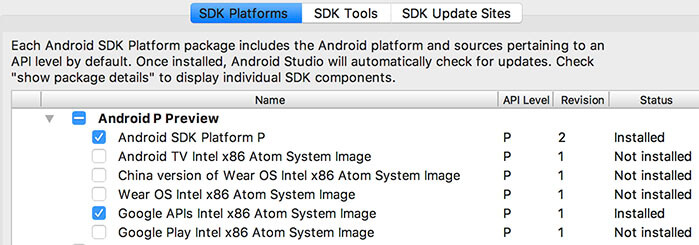
1. Install the WebAssembly Package using the Maintenance Tool

Installing the necessary package for WebAssembly is as easy as for any other target platform. Just open the Maintenance Tool located in your installation directory, select “Add or remove components” and add the WASM package.

2. Prepare and Build your Application using WebAssembly

Felgo for WebAssembly uses the Emscripten compiler to build C++ portable applications to target browsers with WebAssembly support.

All files of your project, including assets, need to be added to the Qt Resource System (qrc) to be available with WebAssembly. If you are not familiar with this, you can find more info here.

Since the Qt Creator plugin for WASM is still in an experimental phase, we recommend using the command line to perform the actual build. You can find all the necessary commands in the documentation: Felgo for WASM – Build your Project

3. Test your Application in the Browser

WASM modules can only be served using a web server. Simply opening the resulting .html file with your browser will not work. But it is easy to run it using a local web server for testing.

After you built your app, go to the build folder, enter the dist folder and run the following command to launch the application with the included local web server:

emrun --browser chrome index.html

You can find more info and alternative ways to launch your App here.

Use WebAssembly with Felgo Cloud Builds

Soon you will also be able to build your application using Felgo Cloud Builds, the CI/CD for Felgo and Qt projects. This allows you to easily build and distribute your application in the cloud, without installing the local toolchain for WebAssembly or any other target platform.

More Additions of Felgo 3.5.0

Update to Qt Creator 4.11.2

With Felgo 3.5.0, you get access to a newer Qt Creator version, with many improvements and better stability, for a better development experience.

Use Amplitude Analytics Plugin on Desktop & Embedded

This update adds support for the Amplitude analytics plugin on desktop and Embedded Linux platforms. You can now easily track sessions and events in your application like this:

import Felgo 3.0

Amplitude {
  id: amplitude
  
  // From Amplitude Settings
  apiKey: ""
  
  onPluginLoaded: {
    amplitude.logEvent("App started");
  }
}

Note that the Amplitude plugin will now also send events during development on desktop by default. If that is not desired, make sure to remove the apiKey during development, or e.g. check if system.publishBuild is set.

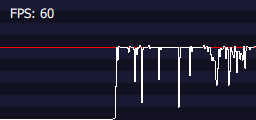
Spot Performance Issues with the FpsMeter

The new FpsMeter component allows you to quickly spot drops in the framerate of your app or game across all platforms or test devices. This serves as a quick mini-profiler to spot potential performance issues in your application.

import Felgo 3.0
import QtQuick 2.0

App {
  id: app
  
  Page {
    // ... UI items go here ...
  }
  
  // Simply place the FpsMeter on top of other UI elements, no additional
  // configuration is required as all properties are set to sensible defaults.
  FpsMeter {
  }
  
}

More Features, Improvements and Fixes

Felgo 3.5.0 includes many more features, for example:

  • QML Hot Reloading now supports the QML on-syntax. You can add property value sources like PropertyAnimation on x and property value interceptors like Behavior on x at runtime using Hot Reloading.
  • Several stability improvements for QML Hot Reload with Felgo Live.
  • Fixes a potential crash on Android with the Soomla Plugin for in-app purchases.
  • The new method NativeUtils::deviceManufacturer() provides information about the mobile device manufacturer.

For all relevant changes, features and fixes of recent Felgo updates, please check out the changelog.

How to Update Felgo

Test out these new features by following these steps:

  • Open the Felgo SDK Maintenance Tool in your Felgo SDK directory.
  • Choose “Update components” and finish the update process to get this release as described in the Felgo Update Guide.

Update Felgo

If you haven’t installed Felgo yet, you can do so now with the latest installer from here. Now you can explore all of the new features included in this release!

For a full list of improvements and fixes to Felgo in this update, please check out the change log!


More Posts Like This


QML Hot Reload with Felgo Live for Qt


Release 3.4.0: QML Hot Reload with Felgo Live


Release 3.3.0: Update to Qt 5.13.2 and Qt Creator 4.10.2, Jira Tima App Demo

The post Release 3.5.0: Run your Qt and Felgo Apps in the Browser with WebAssembly (WASM) appeared first on Felgo.


Francesc M. Qt Blog: GitQlient: Multi-platform Git client written with Qt

$
0
0

I'm happy to announce the release of GitQlient 1.0.0.

For the version 1.0.0 I've implemented all the features that were part of GitQlientPlugin with some fixes and improvements. A way more that I initially thought. I've been using GitQlient for the last two weeks in my day-to-day work and I feel it's ready for this first version!

GitQlient: Multi-platform Git client written with Qt first appeared on My C++ & Qt blog - Cesc M..

V-Play Engine: QML Hot Reload: Felgo presents hot new feature at Embedded World 2020!

$
0
0

This year’s Embedded World exhibition & conference has concluded. Felgo attended as Qt Technology Partner at the Qt booth.

Visitors were able to put their hands on one of our hottest new features:QML Hot Reload(pun intended!). Here’s a quick video of the demo right at the booth:


Short live demo of QML Hot Reload at the booth.


Hot Reload with Felgo Live allows you to change your QML & JavaScript source code and view the result in realtime. It applies QML, JavaScript and asset changes instantly on every connected device, on any platform, includingembedded. This reduces the long waiting times for build and deployment steps to only a couple of seconds. 

Hot Reload applies changes in your source code without losing the state of your application. If you are currently working on a sub-page, you will not have to navigate back to it after every change, you will stay exactly where you are in your app.

Stay tuned for the upcoming official announcement of QML Hot Reload with Felgo Live, as part of the upcoming Felgo 3.4.0 update!


Get Started with Felgo for Embedded


The Felgo booth – thank you for stopping by!


The Coronavirus, that just started to spread in northern Italy the week before the show, had a significant impact on the event. Some major exhibitors were missing, and attendance was also significantly down compared to 2019.

Even though the show was smaller than the last few years, it was great to connect & network with our customers, partners and many new people! We’re looking forward to having more conversations in the coming weeks & months on how to support developers with the latest technologies around Felgo, Qt & embedded systems development.

Test the new features now in the Felgo SDK. Download for free today!

The post QML Hot Reload: Felgo presents hot new feature at Embedded World 2020! appeared first on Felgo.

V-Play Engine: How to Handle Safe Area Insets, Notch & Display Cutout for iPhone X, iPad X and Android P – 2020

$
0
0

More and more mobile devices feature a notch (or display cutout, as it is called on Android). To handle this little monster, mobile app developers now face many new challenges.

The trend is spreading fast and many manufacturers already announced new 2018 models with edge-to-edge screens. For example with Android P devices like Essential Phone, OnePlus 6, Oppo R15 Pro, Vivo X21, LG G7, Huawei P20 or Asus Zenfone 5. Similar to the iPhone X, Apple’s new iPad Pro model, the iPad X, will also include a notch and feature Face ID.


How hard can it be to support the notch – maybe one or two days to optimize existing apps for it?


That’s what we initially thought. As it turned out, it was a lot harder than expected. We ran into many bumps along the road of porting 20+ apps & games to properly support it.

As a native iOS and Android developer, you will experience similar issues yourself when you start to develop for devices with edge-to-edge screens. For iOS, Apple even requires you to support iOS 11 and the notch: All new apps & app updates submitted after July 2018 get rejected otherwise.

So we put up our sleeves and prepared this guide to show you how to support the notch in your apps. Thus the sooner you start following this guide the better you are prepared for the Apple change coming in July and for upcoming Android P changes.

The tips provided in this guide apply for both iOS and Android and are useful for cross-platform developers as well. Along the way, we also modified all the components in Felgo, a cross-platform framework for app & game development. It now supports the notch out-of-the-box, so you don’t need to go through this „notch hell“ yourself. 🙂

Looking for Qt Training, Consulting or Software Development?

Here we go! We hope you enjoy the „Ultimate Guide to Survive the Notch“:

User Interface Challenges of Devices with Edge-to-Edge Displays

Many manufacturers already announced new models with edge-to-edge screens, which became even more popular after the release of the iPhone X:

Devices with Edge-to-Edge Screens and a Notch or Display Cutout

Such screens allow to get the most out of the available space the device offers. In addition to the rounded edges, there is a main pain point for mobile app developers: the notch.

iPhone X with Edge-To-Edge Display vs. iPhone 8

Instead of a clear rectangular frame, app developers now face arbitrary shaped screens. Also, hardware buttons at the front no longer exist. They got replaced by on-screen buttons and gestures provided by the OS. The following sections describe how to create adaptive layouts to handle those challenges for both iOS & Android. While this post uses examples for iPhone X, the same concepts and suggested solutions also apply for other devices & platforms with similar screens, like upcoming Android P devices.

Use Felgo’s iOS and Android app development services, in case you need help with that.

Bigger Screen Size and Safe Area of iPhone X

For the iPhone X, the new screen holds two major factors to account for in your mobile app:

  • The screen is bigger in general, so there’s more space your app can use.
  • Your app content should not cover areas with a notch or native on-screen buttons. Otherwise, the elements you place at these parts of the screen are not accessible.

To support different device models and screens, most apps use a responsive layout. This means that the pages use the full height and width to show as much content as possible. This is a good thing. But if the notch and reserved areas are not taken into consideration, some parts of your app are covered or inaccessible.

Full-screen app content gets covered by the notch or on-screen gestures.

In the example screenshots shown above for the iPhone X, the notch covers the top navigation bar in portrait mode and your page content, the list item text, in landscape mode. For both orientations, the area for the home swipe gesture overlays your app at the bottom. Also note that the new screen comes with rounded corners.

To solve this problem, your app needs to consider the safe area of the screen. It is the part of your app, which won’t be covered by the notch or on-screen gestures. The required top and bottom screen insets determine the safe area in portrait mode:

Top and bottom insets determine the safe area in portrait mode.

For example, the navigation bar requires more padding at the top to be within the safe area. In landscape mode it looks a bit different. We then require margins to the left and right (for the rounded corners and the notch), as well as a small inset at the bottom (for the home swipe gesture):

Insets to the left, right and bottom determine the safe area in landscape mode.

How Do Existing Apps Look on iPhone X?

If you are worrying that your published app is already affected by the notch, you can relax. Only apps configured to target iPhone X will run full-screen. Your existing iOS apps will come with black borders as shown on the right in this image, to not overlay areas with a notch or screen gestures:

iOS App with and without iPhone X Support

The disadvantages are that the borders do not look good and the app does not match the style of other iPhone X apps – your user’s will realize this and your app will get a worse rating. The black border fallback is simply a backwards compatibility feature by Apple to not break anything. However, it also means some work for us app developers to support the new screen.

How to Create iPhone X Apps with Xcode

Enable iPhone X Support for Your App

Unless your app enables support for iPhone X, it will show with black borders by default. This also means, that your existing apps won’t be affected by the notch. However, if you want to fully support iPhone X and let your app fill the whole screen, you need to add an additional launch image for the iPhone X resolution in Xcode:

Add new launch images to support iPhone X.

Add one image with 2436 x 1125 pixels for landscape mode, and one with 1125 x 2436 pixels if you want to support portrait.

Position Your Content to the Safe Area Layout Guide

Many iOS apps use a navigation bar at the top and a tab bar at the bottom. With iOS 7, Apple decided to add the topLayoutGuide and bottomLayoutGuide properties, which match the insets for these bars in the view. Developers can thus align their content to match these insets.

For iPhone X, it is not enough to only take care of the top and bottom margins. We also have insets to the left and right of the screen, e.g. when in landscape mode. So Apple introduced the new safeAreaLayoutGuide property with iOS 11. The top and bottom layout guides are now deprecated.

Use the safe area layout guide to align your content with the iPhone X safe area.

To make sure your content isn’t covered by the notch, position it to the safe area layout guide. Similar to the previous top and bottom layout guides, this can be done with constraints.

But this simple solution is still far from perfect. Especially in landscape mode, constraining your content area can leave some ugly margins. To avoid this, you can instead add custom insets to your content only where necessary.

The new safeAreaInsets property gives access to the exact pixel inset for the safe area. You can thus tweak the layout to look exactly as you want. For example, you can design the cells of your list items to account for the safe area with a bigger indent. The view content can then cover the whole screen.

Use safe area insets to optimize your layout for landscape mode.

How to Migrate Existing Native iOS Apps to work with Safe Area Insets

To make updating your apps a bit easier, you have the option to activate the Use Safe Area Layout Guides setting for each of your Storyboards in Xcode.

The Storyboard then replaces the top and bottom layout guides with a safe area and updates the constraints. This is a quick first measure to get your app ready for iPhone X.

But as mentioned above, you will still need to check all your views to provide the best possible user experience. For example, to:

  • Let the background of a sub-view use the full screen while keeping the content safe.
  • Decide how to handle the insets when flicking a UIScrollView.
  • Set up your UITableView or UICollectionView to correctly layout for iPhone X.

Full-screen content vs. optimized layout for iPhone X.

Also, you might not be happy with the result of the default Use Safe Area Layout Guides setting in case your app hides the system status bar:

iPhone X Notch Issue with Hidden StatusBar

Due to a bug within the latest iOS 11 SDK, the navigation bar does not account for the notch in this case. Except for some workarounds, there is no simple solution for this issue at the moment of writing this guide. At least when relying on native iOS development with Xcode.

Android P Developer Preview: Display Cutouts

Many Android phone manufacturers already announced their upcoming device models with edge-to-edge displays and rounded corners. For example:

Upcoming Android Devices with Display Cutout

Google also already released the developer preview for Android P. It comes with the ability to handle these so-called display cutouts. In the iOS world, display cutout is equivalent to notch.

How to Test Apps with Display Cutout in Android P

The Android P Developer Preview allows simulation of display cutout. Android P is available with the SDK Manager of Android Studio. It is sufficient to install the Android P SDK and System Image to test on a virtual Android P device:

The Android P Developer Preview is available with the SDK Manager.

After installation is complete, you can start an emulator running Android P. The developer settings on Android P offer four different display cutout options to choose from:

Android P Developer Settings - Display Cutout Simulation

After selecting this option, the Android device will show with a bigger status bar that also includes a display cutout:

Android P Developer Preview with Simulated Display Cutout

The layoutInDisplayCutoutMode attribute controls how the window is laid out if there is a display cutout. By default your Android P app never extends into cutout areas – with a single exception. As visible on the image above, your app can safely cover the full screen for cutouts that do not exceed the status bar area.

Note: The window will lose this ability to extend into the cutout area when FLAG_FULLSCREEN or SYSTEM_UI_FLAG_FULLSCREEN is set.

To let your app always take advantage of the full screen, you can set the value LAYOUT_IN_DISPLAY_CUTOUT_MODE_ALWAYS. You are then responsible to keep your app content within the safe area of the screen. For example, when the device is in landscape mode or if the cutout exceeds the status bar in portrait.

Custom Layouts with Safe Area Insets in Android P

Like iOS 11, Android P includes features to determine the safe area of the screen and work with the given insets. The new DisplayCutout class lets you find out the location and shape of the non-functional areas where content shouldn’t be displayed.

To determine the existence and placement of the cutouts areas, use the getDisplayCutout() method. You can then access the following fields for the DisplayCutout:

Overall it means quite some work to let your app layout adapt to these new displays. Especially for developers that target both iOS and Android.

Save Time and Effort with Felgo Engine for Mobile Apps

Create iOS and Android Apps that Support The Notches and Display Cutouts

Felgo Engine focuses on making mobile app development easy. And it also supports the iPhone X notch and Android P devices with display cutouts out-of-the-box. You can write your app once, and build for iOS, Android or even Desktop with a single button press from 1 IDE. The source code is 100% shared across all platforms.

Felgo Support for Android P and Display Cutouts

Felgo builds upon C++ & Qt and utilizes QML & JavaScript. QML is a fast and easy-to-use declarative UI language. With only a few lines of code, it is possible to create native iOS and Android apps that look native on every device:

import Felgo 3.0
import QtQuick 2.0

App {
  // adds tab navigation (iOS) or drawer menu (Android) 
  Navigation {

    // first tab
    NavigationItem {
      icon: IconType.home
      title: "Main"

      // main page
      NavigationStack {
        Page {
          title: "Main"

          Rectangle {
            anchors.fill: parent // Rectangle fills whole Page
            color: "lightgreen"

            AppText {
              anchors.centerIn: parent // AppText is centered on Page
              text: "Safe Area"
            }
          }
        }
      }
    }

    // second tab
    NavigationItem {
      icon: IconType.gears
      title: "Settings"

      // settings page
      NavigationStack {
        Page { title: "Settings" }
      }
    }

  }
}


This is how the above example app looks like on an iPhone X:

Felgo Support for iPhone X and the Notch

The used components like Navigation and NavigationStack are prepared to work with safe area insets: They automatically include extra margins for the tab and navigation bar if required.

In contrast to the native iOS SDK it is also possible to hide the status bar without any issues. You can do this by setting a single property in your code:

import Felgo 3.0
import QtQuick 2.0

App {
  onInitTheme: {
    Theme.colors.statusBarStyle = Theme.colors.statusBarStyleHidden
  }

  // main page
  NavigationStack {
    Page {
      title: "Main"

      AppButton {
        anchors.horizontalCenter: parent.horizontalCenter
        text: "Toggle Status Bar"
        onClicked: {
          if(Theme.statusBarStyle !== Theme.colors.statusBarStyleHidden)  
            Theme.colors.statusBarStyle = Theme.colors.statusBarStyleHidden
          else
            Theme.colors.statusBarStyle = Theme.colors.statusBarStyleBlack
        }
      }
    }
  }
}

No status bar issue for iPhone X apps created with Felgo.

The top navigation bar in Felgo always supports the notch automatically, even with a hidden status bar.

Like the Use Safe Area Layout Guide setting for Xcode Storyboards, the content of your pages does not overlap reserved areas of the screen. But Felgo requires no extra setting to achieve this. The page content aligns with the safe area out-of-the box. For devices without a notch, the app does not show any extra margins or insets:

Felgo Components are prepared to support the safe area out-of-the-box.

Note: Configure iPhone X launch images for your iOS app to get full-screen support on iPhone X if you have an existing Felgo app. For new apps, this is set up automatically.

Optimize your User Interface with Adaptive Layouts

For most use cases, the default settings are fine to let your app look good on devices with and without display cutouts. If you want more control over how to display your content, you can disable the useSafeArea setting of each Page. You then have two options to work with the safe area:

  1. Configure only certain content items within the Page to align with the safe area.
  2. Retrieve the exact safe area inset of the screen and layout items as required.

The following example deactivates the useSafeArea setting and shows both options:

import Felgo 3.0
import QtQuick 2.0

App {

  Page {
    useSafeArea: false // the page content can use all available space

    // fill whole page/screen with blue color (background)
    Rectangle {
      anchors.fill: parent
      color: "lightblue"
    }

    // Option 1: fill only safe area with green color (content)
    Rectangle {
      anchors.fill: parent.safeArea
      color: "lightgreen"
    }

    // Option 2: adaptive background to cover top inset area (or status bar area on devices without insets)
    Rectangle {
      width: parent.width
      height: nativeUtils.safeAreaInsets.top > 0 ? nativeUtils.safeAreaInsets.top : nativeUtils.statusBarHeight()
      color: "yellow"
    }
  }

}


The page content can now cover the full screen by default. You can use the safeArea property of the Page to align items with the safe area of the screen. In the above example, we use this to fill the safe area with a green rectangle. This is where you can place your content items.

The nativeUtils.safeAreaInsets hold the exact safe area insets of the screen in pixels. Devices without a notch do not have any insets and thus return 0. For iPhone X, the yellow rectangle will cover the top inset, which includes the status bar. To also support older devices, you fill the status bar if no inset is returned by nativeUtils.safeAreaInsets.top.

The available safeAreaInsets properties are:

  • nativeUtils.safeAreaInsets.top
  • nativeUtils.safeAreaInsets.right
  • nativeUtils.safeAreaInsets.bottom
  • nativeUtils.safeAreaInsets.left

Running this app on iOS or Android produces the following result:

Create adaptive layouts to perfectly support the notch or display cutouts in your apps.

Developing adaptive user interfaces this way is very convenient. The following example shows how you could use nativeUtils.safeAreaInsets.left to add more indent for the cells of a list.

import Felgo 3.0
import QtQuick 2.0

App {

  NavigationStack {
    ListPage {
      title: "List Page"
      useSafeArea: false // the page fills all available space
      model: 50 // quick way to populate the list with 50 items

      // UI for cells of the list
      delegate: SimpleRow {
        text: "Item #"+index

        // set indent of the cells
        // matches the safe area inset or minimum 16 dp (if no inset required, e.g. in portrait mode or on older devices)
        style.indent: Math.max(nativeUtils.safeAreaInsets.left, dp(16))
      }
    }
  }
  
}

With such simple additions, you can make sure that your app looks pixel-perfect on screens with and without safe area insets.

Adaptive Layout Example: Full-width list cells in landscape mode.

You don’t need to add such tweaks for apps that offer the default UI with a navigation bar and tab bar. The Felgo page and navigation components look good on all devices and adapt their style automatically.

Support for Display Cutout on Android P Devices

Felgo Engine is a cross-platform development tool that supports both Android and iOS. You can take the QML code of your iOS app and directly build for Android, or vice-versa. All components change their look and behavior then. They match the native style and user experience of the given platform:

Felgo Supports both iOS 11 and Android P.

The above image shows the Android and iOS style for the same example app. The Android style is already prepared to support edge-to-edge screens. No extra work is required, to make your app work cross-platform for iOS & Android with display cutouts, safe area and a notch!

Simulate Safe Area Insets while Developing on Desktop

It takes quite some time to always build and deploy to your phone or the simulator. With Felgo you can run and test your app directly on Desktop. It is even possible to simulate different devices and resolutions to see how your app will look like. You can change the resolution at runtime, without having to restart your app. This is a huge time-saver for UI development & testing! Native development for Android or iOS requires deployment to another real or virtual device to test the UI.

Felgo Device Resolution Simulation on Desktop

Along with the support for a display notch, Felgo also comes with a new resolution simulator entry for iPhone X. And the best thing is: It even covers the safe area insets you get on a real device:

iPhone X Desktop Simulation with Safe Area Insets

Felgo Engine is thus a huge time-saver when developing for iOS and Android. The Felgo SDK is free to use, so make sure to check it out!

If you need help with your mobile app development, use Felgo’s consulting and app development services.

More Relevant App Development Resources

The Best App Development Tutorials & Free App Templates

All of these tutorials come with full source code of the mobile apps! You can copy the code to make your own apps for free!

App Development Video Tutorials


Thanks for reading & scrolling that far! 🙂

Do you have suggestions for posts or tutorials about app development?
Simply send us a message which tutorial you’d like to see here.


More Posts Like This

feature
How to Make Cross-Platform Mobile Apps with Qt – Felgo Apps

teaser-iphonex-support-and-runtime-screen-orientation-change-705px
Release 2.16.0: iPhone X Support and Runtime Screen Orientation Changes

How to Expose a Qt C++ Class with Signals and Slots to QML

The post How to Handle Safe Area Insets, Notch & Display Cutout for iPhone X, iPad X and Android P – 2020 appeared first on Felgo.

V-Play Engine: Release 3.4.0: QML Hot Reload with Felgo Live

$
0
0

Felgo 3.4.0 introduces QML Hot Reload to cut the waiting times to build, deploy and iterate on Qt and Felgo projects.

Hot Reload with Felgo Live allows you to change your QML & JavaScript source code and view the result in realtime. It applies QML, JavaScript and asset changes instantly on every connected device, immediately after saving. This reduces the long waiting times for build and deployment steps to only a couple of seconds.

Hot Reload applies changes in your source code without losing the state of your application. If you are currently working on a sub-page, you will not have to navigate back to it after every change, you will stay exactly where you are in your app.

You can also test your projects on mobile, without installing native mobile SDKs, only by installing the Felgo Live App on your device. Hot Reload even works on embedded devices!


Hot Reload can be used with Felgo and also pure Qt projects, on any platform. Hot Reload is available for any Felgo user, including the free Personal license.

Try Hot Reload Now

Hot Reloading for QML, JavaScript and Assets

Hot Reload keeps your application running while it applies code changes. This means your app or game keeps its exact state when reloading. This helps speed up development even more than with live reloading.

Incremental UI building

You can build your user interface incrementally while navigating it at the same time, and iterate on any sub-page without navigating to it repeatedly. You can add navigation items, pages and sub pages and modify their content and immediately see the outcome on multiple platforms.

Work on a single screen until it is pixel perfect, without ever leaving it. Felgo Live will fully preserve the application state and apply the change directly in your running app. No need to navigate back to the sub-page or popup that you are currently working on after each change.

Define interaction seamlessly

Hot Reload also allows you to add any form of interaction to the running QML application. You can add property bindings, signal handlers and regular JavaScript functions at any point to the QML tree. The new definitions are effective immediately.

Support for Custom C++ and Native Code

If your application contains any custom C++ code, native code, additional libraries or any Qt module that is not already pre-configured with the default Live Client app, you can make use of the Live Client Module.

This C++ module can be added to your own project with 3 lines of code. This will enhance your own application with Hot Reload features. Just build it normally for any desired platform and connect it to your Live Server, just like the default Live Client.

You can find more information about the Live Client Module in the documentation.

How to Use Hot Reloading with Felgo Live

You can find a detailed guide in the documentation. Here is a short summary of the steps.

Note: If you already use Live Reloading, just update Felgo and your Live Client apps and you are ready to go.

After installing/updating Felgo, if you open a project in Qt Creator, the Felgo Live Server will automatically start. You can also manually start the Live Server using the “Live Run” button, the green triangle with “LIVE” in Qt Creator.

Depending on your autostart setting of the Desktop Live Client, you will also see the Felgo Live Client application start. You can also start the Live Client for Desktop with the start button in your Live Server.

The Live Server is watching for changes in your source code, and pushes the changes to the Live Client, which will display your application.

You can also connect your mobile device to the Live Server. Just download the Felgo Live Scripting app for iOS or Android directly on your device, click connect, and accept the request in your Live Server. Every code change will then be displayed on any connected device at the same time.

The new Hot Reload feature can also be disabled, to only use Live Reloading instead. This can be helpful if you experience any issue with your specific setup, or Hot Reloading is not desired for any reason. A full reload can also be triggered at any time.

Please refer to the documentation for more details.

How does Hot Reload with Felgo Live Work?

You will be able to get a closer look at how Hot Reloading works soon, in another blog post. For those who can’t wait, there are also some insights in the documentation.

UPDATE: Here is the new post with many details about how QML Hot Reload works and why you should use it: QML Hot Reload with Felgo Live for Qt

Firebase Authentication using your Google/Gmail Account

With Felgo 3.4.0 you can now also let your users log in to Firebase with their Google/Gmail account, with the new loginUserWithGoogle() method.

More Features, Improvements and Fixes

Felgo 3.4.0 includes many more features, for example:

  • OneSignal::notificationReceived() now provides information about the push notification’s action buttons.
  • NativeUtils::contacts now contains more information about contacts. The new information includes postal addresses, email addresses, company name and phone number types.
  • The Facebook Plugin now supports the native SDK v5.13.0 on iOS.
  • Examples now use the latest project format of Felgo, which allows you to provide more configuration values, like the license key, from your *.pro file.
  • NativeUtils::displayImagePicker() no longer leaves behind a temporary file on iOS.
  • Fixes the Deprecated API Usage warning for UIWebView when uploading an app to the iOS App Store.
  • Fixes an Android SSL version issue while building, which previously required you to apply a hotfix.
  • Fixes a crash with the OneSignal requestTags method.
  • Fixes an issue with Android 10 API blacklisting.

For all relevant changes, features and fixes of recent Felgo updates, please check out the changelog.

How to Update Felgo

Test out these new features by following these steps:

  • Open the Felgo SDK Maintenance Tool in your Felgo SDK directory.
  • Choose “Update components” and finish the update process to get this release as described in the Felgo Update Guide.

Update Felgo

If you haven’t installed Felgo yet, you can do so now with the latest installer from here. Now you can explore all of the new features included in this release!

For a full list of improvements and fixes to Felgo in this update, please check out the change log!


More Posts Like This


Release 3.3.0: Update to Qt 5.13.2 and Qt Creator 4.10.2, Jira Tima App Demo

Release-3-2-0-Qt-5123-EcmaScript7-QtCreator-482
Release 3.2.0: Update to Qt 5.12.3 with ECMAScript 7, Subscriptions, Image Picker and Qt Creator 4.8.2


Release 3.1.0: New Felgo Plugins Version, Unified App Configuration and FlickablePage

The post Release 3.4.0: QML Hot Reload with Felgo Live appeared first on Felgo.

KDAB on Qt: Debugging and Profiling Qt 3D applications

$
0
0

Qt 3D, being a retained mode high level graphic API abstraction, tries to hide most of the details involved in rendering the data provided by applications. It makes a lot of decisions and operations in the background in order to get pixels on the screen. But, because Qt 3D also has very rich API, developers can have a lot of control on the rendering by manipulating the scene graph and, more importantly, the frame graph. It is however sometimes difficult to understand how various operations affect performance.

In this article, we look at some of the tools, both old and new, that can be used to investigate what Qt 3D is doing in the back end and get some insight into what is going on during the frame.


Built in Profiling

The first step in handling performance issues is, of course, measuring where time is spent. This can be as simple as measuring how long it took to render a given frame. But to make sense of these numbers, it helps to have a notion of how complex the scene is.

In order to provide measurable information, Qt 3D introduces a visual overlay that will render details of the scene, constantly updated in real time.


The overlay shows some real time data:

  • Time to render last frame and FPS (frames per second), averaged and plotted over last few seconds. As Qt 3D is by default locking to VSync, this should not exceed 60fps on most configurations.
  • Number of Jobs: these are the tasks that Qt 3D executes on every frame. The number of jobs may vary depending on changes in the scene graph, whether animations are active, etc.
  • Number of Render Views: this matches loosely to render pass, see below discussion on the frame graph.
  • Number of Commands: this is total number of draw calls (and compute calls) in the frame.
  • Number of Vertices and Primitives (triangles, lines and points combined).
  • Number of Entities, Geometries and Textures in the scene graph. For the last two, the overlay will also show the number of geometries and textures that are effectively in use in the frame.

As seen in the screen shots above, the scene graph contains two entities, each with one geometry. This will produce two draw calls when both objects are in frame. But as the sphere rotates out of the screen, you can see the effect of the view frustum culling job which is making sure the sphere doesn’t get rendered, leaving a single draw call for the torus.

This overlay can be enabled by setting the showDebugOverlay property of the QForwardRenderer to true.


Understanding Rendering Steps

To make sense of the numbers above, it helps to understand the details of the scene graph and frame graph.

In the simple case, as in the screen shots, an entity will have a geometry (and material, maybe a transform). But many entities may share the same geometry (a good thing if appropriate!). Also, entities may not have any geometry but just be used for grouping and positioning purposes.

So keeping an eye on the number of entities and geometries, and seeing how that effects the number of commands (or draw calls), is valuable. If you find one geometry drawn one thousand times in a thousand separate entities, if may be a good indication that you should refactor your scene to use instanced rendering.

In order to provide more details, the overlay has a number of buttons that can be used to dump the current state of the rendering data.

For a deeper understanding of this, you might consider our full Qt 3D Training course.

Scene Graph

Dumping the scene graph will print data to the console, like this:

Qt3DCore::Quick::Quick3DEntity{1} [ Qt3DRender::QRenderSettings{2}, Qt3DInput::QInputSettings{12} ]
  Qt3DRender::QCamera{13} [ Qt3DRender::QCameraLens{14}, Qt3DCore::QTransform{15} ]
  Qt3DExtras::QOrbitCameraController{16} [ Qt3DLogic::QFrameAction{47}, Qt3DInput::QLogicalDevice{46} ]
  Qt3DCore::Quick::Quick3DEntity{75} [ Qt3DExtras::QTorusMesh{65}, Qt3DExtras::QPhongMaterial{48},
                                       Qt3DCore::QTransform{74} ]
  Qt3DCore::Quick::Quick3DEntity{86} [ Qt3DExtras::QSphereMesh{76}, Qt3DExtras::QPhongMaterial{48}, 
                                       Qt3DCore::QTransform_QML_0{85} ]

This prints the hierarchy of entities and for each of them lists all the components. The id (in curly brackets) can be used to identify shared components.

Frame Graph

Similar data can be dumped to the console to show the active frame graph:

Qt3DExtras::QForwardRenderer
  Qt3DRender::QRenderSurfaceSelector
    Qt3DRender::QViewport
      Qt3DRender::QCameraSelector
        Qt3DRender::QClearBuffers
          Qt3DRender::QFrustumCulling
            Qt3DRender::QDebugOverlay

This is the default forward renderer frame graph that comes with Qt 3D Extras.

As you can see, one of the nodes in that graph is of type QDebugOverlay. If you build your own frame graph, you can use an instance of that node to control which surface the overlay will be rendered onto. Only one branch of the frame graph may contain a debug node. If the node is enabled, then the overlay will be rendered for that branch.

The frame graph above is one of the simplest you can build. They may get more complicated as you build effects into your rendering. Here’s an example of a Kuesa frame graph:

Kuesa::PostFXListExtension
  Qt3DRender::QViewport
    Qt3DRender::QClearBuffers
      Qt3DRender::QNoDraw
    Qt3DRender::QFrameGraphNode (KuesaMainScene)
      Qt3DRender::QLayerFilter
        Qt3DRender::QRenderTargetSelector
          Qt3DRender::QClearBuffers
            Qt3DRender::QNoDraw
          Qt3DRender::QCameraSelector
            Qt3DRender::QFrustumCulling
              Qt3DRender::QTechniqueFilter
                Kuesa::OpaqueRenderStage (KuesaOpaqueRenderStage)
                  Qt3DRender::QRenderStateSet
                    Qt3DRender::QSortPolicy
            Qt3DRender::QTechniqueFilter
              Kuesa::OpaqueRenderStage (KuesaOpaqueRenderStage)
                Qt3DRender::QRenderStateSet
                  Qt3DRender::QSortPolicy
            Qt3DRender::QFrustumCulling
              Qt3DRender::QTechniqueFilter
                Kuesa::TransparentRenderStage (KuesaTransparentRenderStage)
                  Qt3DRender::QRenderStateSet
                    Qt3DRender::QSortPolicy
            Qt3DRender::QTechniqueFilter
              Kuesa::TransparentRenderStage (KuesaTransparentRenderStage)
                Qt3DRender::QRenderStateSet
                  Qt3DRender::QSortPolicy
          Qt3DRender::QBlitFramebuffer
            Qt3DRender::QNoDraw
    Qt3DRender::QFrameGraphNode (KuesaPostProcessingEffects)
      Qt3DRender::QDebugOverlay
        Qt3DRender::QRenderStateSet (ToneMappingAndGammaCorrectionEffect)
          Qt3DRender::QLayerFilter
            Qt3DRender::QRenderPassFilter

If you are not familiar with the frame graph, it is important to understand that each path (from root to leaf) will represent a render pass. So the simple forward renderer will represent a simple render pass, but the Kuesa frame graph above contains eight passes!

It is therefore often easier to look at the frame graph in term of those paths. This can also be dumped to the console:

[ Kuesa::PostFXListExtension, Qt3DRender::QViewport, Qt3DRender::QClearBuffers, Qt3DRender::QNoDraw ]
[ Kuesa::PostFXListExtension, Qt3DRender::QViewport, Qt3DRender::QFrameGraphNode (KuesaMainScene),
  Qt3DRender::QLayerFilter, Qt3DRender::QRenderTargetSelector, Qt3DRender::QClearBuffers, Qt3DRender::QNoDraw ]
[ Kuesa::PostFXListExtension, Qt3DRender::QViewport, Qt3DRender::QFrameGraphNode (KuesaMainScene), 
  Qt3DRender::QLayerFilter, Qt3DRender::QRenderTargetSelector, Qt3DRender::QCameraSelector, Qt3DRender::QFrustumCulling, 
  Qt3DRender::QTechniqueFilter, Kuesa::OpaqueRenderStage (KuesaOpaqueRenderStage), Qt3DRender::QRenderStateSet, 
  Qt3DRender::QSortPolicy ]
[ Kuesa::PostFXListExtension, Qt3DRender::QViewport, Qt3DRender::QFrameGraphNode (KuesaMainScene), 
  Qt3DRender::QLayerFilter, Qt3DRender::QRenderTargetSelector, Qt3DRender::QCameraSelector, Qt3DRender::QTechniqueFilter, 
  Kuesa::OpaqueRenderStage (KuesaOpaqueRenderStage), Qt3DRender::QRenderStateSet, Qt3DRender::QSortPolicy ]
[ Kuesa::PostFXListExtension, Qt3DRender::QViewport, Qt3DRender::QFrameGraphNode (KuesaMainScene),
  Qt3DRender::QLayerFilter, Qt3DRender::QRenderTargetSelector, Qt3DRender::QCameraSelector, Qt3DRender::QFrustumCulling,
  Qt3DRender::QTechniqueFilter, Kuesa::TransparentRenderStage (KuesaTransparentRenderStage), Qt3DRender::QRenderStateSet,
  Qt3DRender::QSortPolicy ]
[ Kuesa::PostFXListExtension, Qt3DRender::QViewport, Qt3DRender::QFrameGraphNode (KuesaMainScene),
  Qt3DRender::QLayerFilter, Qt3DRender::QRenderTargetSelector, Qt3DRender::QCameraSelector, Qt3DRender::QTechniqueFilter,
  Kuesa::TransparentRenderStage (KuesaTransparentRenderStage), Qt3DRender::QRenderStateSet, Qt3DRender::QSortPolicy ]
[ Kuesa::PostFXListExtension, Qt3DRender::QViewport, Qt3DRender::QFrameGraphNode (KuesaMainScene),
  Qt3DRender::QLayerFilter, Qt3DRender::QRenderTargetSelector, Qt3DRender::QBlitFramebuffer, Qt3DRender::QNoDraw ]

Hopefully this is a good way of finding out issues you may have when building your custom frame graph.

Draw Commands

On every pass of the frame graph, Qt 3D will traverse the scene graph, find entities that need to be rendered, and for each of them, issue a draw call. The number of objects drawn in each pass may vary, depending on whether the entities and all of their components are enabled or not, or whether entities get filtered out by using QLayers (different passes may draw different portions of the scene graph).

The new profiling overlay also gives you access to the actual draw calls.

So in this simple example, you can see that two draw calls are made, both for indexed triangles. You can also see some details about the render target, such as the viewport, the surface size, etc.

That information can also be dumped to the console which makes it easier to search in a text editor.


Built in Job Tracing

The data above provides a useful real time view on what is actually being processed to render a particular frame. However, it doesn’t provide much feedback as to how long certain operations take and how that changes during the runtime of the application.

In order to track such information, you need to enable tracing.

Tracing tracks, for each frame, what jobs are executed by Qt 3D’s backend. Jobs involve updating global transformations and the bounding volume hierarchy, finding objects in the view frustum, layer filtering, picking, input handling, animating, etc. Some jobs run every frame, some only run when internal state needs updating.

If your application is slow, it may be because jobs are taking a lot of time to complete. But how do you find out which jobs take up all the time?

Qt 3D has had tracing built in since a few years already, but it was hard to get to. You needed to do your own build of Qt 3D and enable tracing when running qmake. From thereon, every single run of an application linked against that build of Qt 3D would generate a trace file.

In 5.15, tracing is always available. It can be enabled in two ways:

  • By setting the QT3D_TRACE_ENABLED environment variable before the application starts (or at least before the aspect engine is created). This means the tracing will happen for the entire run of the application.
  • If you’re interested in tracing for a specific part of your application’s life time, you can enable the overlay and toggle tracing on and off using the check for Jobs. In this case, a new trace file will be generated every time the tracing is enabled.

For every tracing session, Qt 3D will generate one file in the current working directory. So how do you inspect the content of that file?

KDAB provides a visualisation tool but it is not currently shipped with Qt 3D. You can get the source and build it from GitHub here. Because jobs change from one version of Qt 3D to the next, you need to take care to configure which version was used to generate the trace files. Using that tool, you can open the trace files. It will render a time line of all the jobs that were executed for every frame.

In the example above, you can see roughly two frames worth of data, with jobs executed on a thread pool. You can see the longer running jobs, in this case:

  • RenderViewBuilder jobs, which create all the render views, one for each branch in the frame graph. You can see some of them take much longer that others.
  • FrameSubmissionPart1 and FrameSubmissionPart2 which contain the actual draw calls.

Of course, you need to spend some time understanding what Qt 3D is doing internally to make sense of that data. As with most performance monitoring tools, it’s worth spending the time experimenting with this and seeing what gets affected by changes you make to your scene graph or frame graph.

Job Dependencies

Another important source of information when analysing performance of jobs is looking at the dependencies. This is mostly useful for developers of Qt 3D aspects.

Using the profiling overlay, you can now dump the dependency graph in GraphViz dot format.

Other Tools

Static capabilities

Qt 3D 5.15 introduces QRenderCapabilities which can be used to make runtime decisions based on the actual capabilities of the hardware the application is running on. The class supports a number of properties which report information such as the graphics API in use, the card vendor, the supported versions of OpenGL and GLSL. It also has information related to the maximum number of samples for MSAA, maximum texture size, if UBOs and SSBOs are supported and what their maximum size is, etc.

Third Party Tools

Of course, using more generic performance tools is also a good idea.

perf can be used for general tracing, giving you insight where time is spent, both for Qt 3D and for the rest of your application. Use it in combination with KDAB’s very own hotspot to get powerful visualisation of the critical paths in the code.

Using the flame graph, as show above (captured on an embedded board), you can usually spot the two main sections of Qt 3D work, the job processing and the actual rendering.

Other useful tools are the OpenGL trace capture applications, either the generic ones such as apitrace and renderdoc, or the ones provided your hardware manufacturer, such as nVidia or AMD.


Conclusion

We hope this article will help you get more performance out of your Qt 3D applications. The tools, old and new, should be very valuable to help find bottlenecks and see the impact of changes you make to your scene graph or frame graph. Furthermore, improvements regarding performance are in the works for Qt 6, so watch this space!

About KDAB

If you like this blog and want to read similar articles, consider subscribing via our RSS feed.

Subscribe to KDAB TV for similar informative short video content.

KDAB provides market leading software consulting and development services and training in Qt, C++ and 3D/OpenGL. Contact us.

The post Debugging and Profiling Qt 3D applications appeared first on KDAB.

KDAB on Qt: Training at Qt World Summit 2020

$
0
0

Qt World Summit 2020 has been postponed until October 20-22. It will take place in Palm Springs, USA.

KDAB will be running 3 one day training classes on October 20th:

  • Advanced QML
  • Multithreading in Qt, and
  • Introduction to Qt 3D

Let’s tell you a bit more about those classes before you sign up and catch the extended Early Bird discount.

Advanced QML
with Giuseppe D’Angelo

Prerequisite: Functional knowledge of QML (more than 1 year of experience)

The advanced QML course is designed to take programmers who already know QML to a deeper level of functional understanding and equips them with the cutting edge QML skills and know-how to boost their productivity at work.

Topics include:
  • Advanced integration of QML, JavaScript and C++
  • Using OpenGL in custom QML elements
  • Analysing and profiling the Qt Quick scene graph
  • Understanding and removing bottlenecks that affect a QML UI
  • Best practices for achieving optimal performances, even on constrained hardware resources

Target audience: Experienced QML developers targeting embedded and/or mobile platforms.

About Giuseppe D’Angelo

Senior Software Engineer at KDAB. Giuseppe is a long-time contributor to Qt, having used Qt and C++ since 2000, and is an Approver in the Qt Project. His contributions in Qt range from containers and regular expressions to GUI, Widgets and OpenGL. A free software passionate and UNIX specialist, before joining KDAB, he organized conferences on opensource around Italy. He holds a BSc in Computer Science.

Multithreading in Qt
with Jim Albamont

Prerequisite: Knowledge and experience programming with Qt and C++. A basic understanding of multithreaded programming is an advantage but not required.

Multithreaded programming is essential for developers to create fast and responsive applications on computers, phones, and embedded devices all with an increasing number of cores. Qt offers several mechanisms for multithreading; however, it can be difficult to know which to use and how to steer clear of common pitfalls. This course offers guidance how to write safe and efficient multithreaded code with Qt.

Topics include:
  • Basic multithreading concepts (threads, processes, data races, reentrency, shared data)
  • Synchronization primitives (mutexes, semaphores, condition variables)
  • Special concerns for Qt applications (cross-thread signals/slots, QObject thread affinity, the GUI thread)
  • Low-level multithreading with Qt (QThread, QThreadPool, QMutex, etc)
  • High-level multithreading with Qt (QtConcurrent)
  • A brief summary of atomic operations
  • Comparison between Qt and standard C++ multithreading programming

Target Audience: Qt Developers interested in multithreaded programming

About Jim Albamont

Senior Software Engineer at KDAB. Jim has actively developed with Qt since 2001. He has a background in computer graphics and data visualization, including 6 years as the lead developer of a multithreaded 3D visualization tool for financial data built with Qt and OpenGL. He has held Qt training classes throughout the US where he is based. Jim holds an MSc in Computer Science.

Introduction to Qt 3D
with Mike Krus

Prerequisite: This course requires use of Qt 5.7.1 or higher and assumes prior knowledge of Qt Quick. No prior OpenGL knowledge is required.

In this course you will learn Qt 3D and its use of modern programmable shader-based pipelines which can be applied to both OpenGL and OpenGL ES.

Topics include:
  • Drawing: Geometries, Materials and Lights
  • User Input: Picking, Keyboard Handling, Logical Devices
  • Integration and Helpers: Dynamic Scenes, QtQuick Integration
  • Scene Graph: Graphics Pipeline, GLSL, Coordinate Systems, Texturing
  • Frame Graph: Viewports, Layers, Selecting Shaders at Runtime, Post-processing Effects

Target audience: Developers who want to conveniently and efficiently integrate Qt 3D.

About Mike Krus

Senior Software Engineer at KDAB. Mike has been developing with C++ since 1996 and Qt since 2004. He has a broad range of experience in scientific applications, mainly in civil engineering and oil & gas industries. His range of expertise includes C++, QML and interactive 3D visualization software design on desktop and mobile as well as macOS development. Mike is the Qt maintainer for the tvOS platform, one of the core contributors to Qt 3D and is interested in building mobile applications with Qt, mainly on iOS. He has a PhD in Computer Science.

KDAB trainers regularly contributes insights on Qt, OpenGL, 3D, C++ and more to KDAB blogs.

See what trainees say about our KDAB training.

The post Training at Qt World Summit 2020 appeared first on KDAB.

KDAB on Qt: Qt, range-based for loops and structured bindings

$
0
0

Qt has a long history. The first stable version was released before the first version of C++ was standardized and long before the different C++ compiler vendors started shipping usable implementations of the C++ standard library. Because of this, Qt often followed (and still follows) some design idioms that feel unnatural to the usual C++ developer.

This can have some downsides for the Qt ecosystem. The evolution of the C++ programming language which sped up quite a bit in the last decade often brings improvements which don’t fit well with the Qt philosophy. In this blog, I offer some ways to work with this.

Range-based for loops

C++11 brought us the range-based for loop which allows easy iteration over any iterable sequence, including common containers such as std::vector, std::map, etc.

for (auto name: names) {
    // ...
}

When you write code like the above, the compiler (C++11) sees the following:

        {
            auto && __range = names;
            for (auto __begin = begin(names), __end = end(names); __begin != __end; ++__begin) {
                auto&& name = *__begin;
                // ...
            }
        }

It takes the begin and end iterators of the names collection, and iterates from one to the other.

Rather simple, but it is a very nice syntactical improvement to the language — it is a significant reduction of boilerplate code and much easier on the eyes.

But, it was not designed with Qt collection classes in mind. You can check out the “Goodbye, Q_FOREACH” blog post by Marc for one example where the range-based for loop collided with the Qt design principles, most notably with the copy-on-write feature because of which we got the qAsConst helper function.

Structured bindings

Another new feature, this one from C++17, are the structured bindings.

They add syntactic sugar for decomposing structures. For example, if we have a function that returns a pair of values (std::pair or a QPair) we can declare variables that refer to the values inside of the pair instead of having to access them through .first and .second.

        auto [x, y] = mousePosition();

This can significantly improve code readability. In the previous example, the names x and y communicate the meaning much better than .first and .second would.

This is even more the case if we use a function like QMultiMap::equal_range which returns a pair of iterators delimiting the range of values that are stored under a specified key in a QMap. Seeing participants.equal_range("kdab").second would look like we are accessing the second value in the map that is stored under the “kdab” key. If we used structured bindings, we could have sane variable names:

        auto [beginParticipant, endParticipant] = participants.equal_range("kdab");

Structured bindings can lead to quite succulent code when combined with the range-based for loops for iteration over STL-compliant map-like containers:

        for (auto [key, value]: stdMap) {
            // ...
        }

Each key-value pair in stdMap, will be stored in an invisible (unnamed) variable, and key and value will be references to its inner elements.

Sidebar: don’t be fooled by decltype(key) telling you key is a normal value, for all intents and purposes, it is a reference.

QHash, QMap and STL compatibility

Sadly, the previous code snippet can not work with Qt’s associative containers because the API is not compatible with that of std::map and similar containers.

The problem is in the API of the iterators for QHash and QMap. Instead of returning a key-value pair when you dereference the iterator, it returns only the value. This means that the range-based for loop can only iterate over the values stored inside of the collection, it can not (by default) access the keys:

        for (auto value: map) {
            // ...
        }

When we use the QHash and QMap iterators directly, we can access the key with .key() and the value with .value() but this does not help us with the range-based for loop. As we’ve seen, it is just a syntactic sugar which expands to an ordinary for loop that iterates over a collection automatically dereferencing (calling operator*()) the iterator in each iteration.

So, as far as the range-based for loop is concerned, the key and value member functions do not even exist.

This deficiency of the Qt’s associative containers’ API has been noticed, and QHash and QMap provide us with alternative, more STL-like, iterators since Qt 5.10 — the key_value_iterator and the const_key_value_iterator. When dereferenced, these iterators return a std::pair containing both the key and the value. To quote the Qt documentation:

The QMap::key_value_iterator typedef provides an STL-style iterator for QMap and QMultiMap.

QMap::key_value_iterator is essentially the same as QMap::iterator with the difference that operator*() returns a key/value pair instead of a value.

This means that we can use the structured bindings with them:

        auto [key, value] = *map.keyValueBegin();

But we still cannot use this with the range-based for loop to iterate over all key-value pairs in the collection. The range-based for loop will call .begin() and .end(), and not .keyValueBegin() and .keyValueEnd().

This is easily remedied by creating a simple wrapper over QHash and QMap that will rename.keyValueBegin() and .keyValueEnd() to .begin() and .end() like so:

        template 
        class asKeyValueRange
        {
        public:
            asKeyValueRange(T &data)
                : m_data{data}
            {
            }

            auto begin() { return m_data.keyValueBegin(); }

            auto end() { return m_data.keyValueEnd(); }

        private:
            T &m_data;
        };

Instead of passing a Qt associative container directly to the range-based for loop, we just need to pass it wrapped inside of the asKeyValueRange class, and we will finally be able to use the idiomatic C++17 way of iterating over key-value pairs with QHash and QMap:

        for (auto [key, value]: asKeyValueRange(map)) {
            // ...
        }

It is important to note that this is a somewhat simplified implementation of the asKeyValueRange wrapper that takes the reference to the original QHash/QMap, so it might lead to a dangling reference if used improperly.

Iteration over Qt SQL results

Another part of Qt that hasn’t been designed with common C++ idioms in mind is the Qt SQL module. Its API is designed as if it were a Java library and not a C++ one. Instead of having normal iterators over the results in the QSqlQuery, we need to use the .next() member function to fetch each result. The .next() member function returns a Boolean value denoting if there is another result, and the result itself is accessible through other QSqlQuery member functions.

Apart from the API, iteration over the QSqlQuery results has another difference to usual C++ iterators. The QSqlQuery does not need an end iterator to know whether there is another result available. If .next() or .isValid() return false, this means we have reached the end of the result set.

Having the iterator itself know when it has reached the end of the collection it belongs to is uncommon in STL, but it still is present. The input stream iterator (std::istream_iterator) is one such beast. We cannot know in advance where the end of an input stream is, we can just read values from the stream until the read fails. We have reached the end when the read failed. Similar to to the QSqlQuery— we have reached the end when .next() fails — when it returns false.

In these cases, the end iterator is only needed to fulfil the STL iterator API. It is just a dummy object (usually called a sentinel) that will trigger the validity check on the main iterator when it != end is evaluated.

C++17 brought a small change to the range-based for loop meant for this exact use-case. When C++17 compiler sees the range-based for loop from the first code snippet we had, it will convert it to the following code:

        {
            auto && __range = names;
            auto __begin = begin(names);
            auto __end = end(names);
            for ( ; __begin != __end; ++__begin) {
                auto&& name = *__begin;
                // ...
            }
        }

The difference is easy to overlook.

        auto __begin = begin(names), __end = end(names)

is replaced by

        auto __begin = begin(names);
        auto __end = end(names);

While these two snippets look mostly the same, there is an important difference — in the first snippet, both __begin and __end need to have the same type whereas they can be different in the second.

This allows us to create a begin function that returns a powerful iterator that knows when it has reached the end of a collection, while the end function returns a dummy value — a sentinel.

The sentinel can be just a simple empty type:

        struct QSqlResultSentinel {};

        QSqlResultSentinel end(QSqlQuery& query)
        {
            return {};
        }

The iterator is where the main logic lies. For it to work with the range-based for loop, it needs to know how to do the following operations:

– It needs to have the operator++ that moves to the next result; – It needs to have the operator!= which takes a sentinel object and returns whether iterator is valid or not; – It needs to have the operator* that dereferences the iterator.

The basic implementation of the operator++ and operator!= would look like this:

        class QSqlResultIterator {
        public:
            QSqlResultIterator(QSqlQuery& query)
                : m_query(query)
            {
                m_query.next();
            }

            QSqlResultIterator& operator++()
            {
                m_query.next();
                return *this;
            }

            bool operator!=(QSqlResultSentinel sentinel) const
            {
                Q_UNUSED(sentinel);
                return m_query.isValid();
            }

            // ...

        private:
            QSqlQuery& m_query;
        };

        QSqlResultIterator begin(QSqlQuery& query)
        {
            return QSqlResultIterator(query);
        }

The only thing that remains is for us to decide what the dereference operator should do.

Since each record in the result can contain several values, it would be nice if we provided the operator[] to access those values. Therefore, when we dereference the QSqlResultIterator, we want to get a type that has operator[] defined on it which returns values from the current record.

We have several options on how to do this. The simplest, though not the cleanest, is to have the dereference operator return the reference to the iterator itself, and then define the operator[] in the iterator class.

        class QSqlResultIterator {
        public:
            // ...

            QSqlResultIterator& operator*()
            {
                return *this;
            }

            QVariant operator[] (int index) const
            {
                return m_query.value(index);
            }

            QVariant operator[] (const QString& name) const
            {
                return m_query.value(name);
            }
        };

If we weren’t interested in having the operator[] to access the values, then we could just return the current QSqlRecord with m_query.record() from the operator*().

While this is not a complete iterator implementation (we are missing iterator type traits and similar), it is sufficient for us to be able to use it with a range-based for loop:

        for (auto result: query) {
            qDebug() << result["name"] << result["surname"];
        }

We’ll see what we need to do in order to be able to use structured bindings with Qt SQL in the next part of this post.

About KDAB

If you like this blog and want to read similar articles, consider subscribing via our RSS feed.

Subscribe to KDAB TV for similar informative short video content.

KDAB provides market leading software consulting and development services and training in Qt, C++ and 3D/OpenGL. Contact us.

The post Qt, range-based for loops and structured bindings appeared first on KDAB.


KDAB on Qt: Why is my screen black?

$
0
0

Part 1

So, you’ve just poured your heart and soul into some real-time 3D rendering code and hit render. Wringing your hands in anticipation you wait for the screen to show your marvellous creation. Still… waiting. It says it’s done but, nothing. Well, maybe not nothing but simply darkness. You stare into the deep dark void as your own reflection stares back at you.

Black Screen

Your beautifully rendered item

So, what went wrong?

Issue 1: The rendered object is actually, like some good old English Panto, “behind you!”

This is usually a common issue for the first render. It’s easy to overlook the Z position of the camera and even which way the camera was facing. There are then issues of various libraries and programs using different coordinate systems. OpenGL, for example, looks along the negative Z axis whilst Direct3D uses the positive.

Also if it’s a planar piece of geometry such as a quad to be used as a sprite, ensure that you are not rendering it exactly edge on. Yes we’ve done this too!

Try setting your window clear color to something other than black. That way even if your fragment shader (see later) is broken and outputting all fragments as black you will at least see the silhouette of the object.

Issue 2: You’re inside the object!

So, a few things can be at play here. First of all make sure the coordinates of the camera aren’t the same or too close to the item(s) you are rendering, like with Issue 1. However, you should also double check the ‘model units’. Is the model using mm instead of m, for example. This can be a common issue with shared or imported models.

Once you’ve checked the relative positions and orientation of your camera, also check that the object falls within the limits of the view frustum’s near and far planes.

Issue 3: Your triangle winding could be backwards.

If your winding order is opposite to what you expect and you have back or front face culling enabled then the rasterizer may not be generating any fragments for your object at all.

A fix for this would be to use a tool such as GammaRay or Apitrace to check geometry. In OpenGL you can also disable culling via glDisable(GL_CULL_FACE).

Issue 4: Shaders – are they compiling and linking? Are you feeding them the correct resources?

Make sure that #version is the very first token – no new lines, or anything of the sort before, as some drivers check that religiously. Have your application code check for compilation and linker failures and output any errors. Often it is simple syntactical errors or issues with the interface between shader stages. Also check that your shader stages are outputting exactly what you expect. For fragment shaders, output intermediate variables as a color to see what is going on.

Also use tools such as apitrace, renderdoc or nSight to introspect frames and check that you really have bound the correct set of buffers and textures.

Issue 5: Qt 3D specific: No techniques matched the actual renderer.

When building Qt 3D scenes that are designed to run on multiple platforms, materials need to provide multiple shaders targeting each specific version of OpenGL. Each version information is stored on QTechnique nodes attached to a QEffect node. Similarly, you can implement different algorithms (forward vs deferred rendering for example), so they get assigned filter keys which are key/value pairs. Finally, some algorithms require multiple passes, but may use different shaders in different passes. This pass information is stored in QRenderPass nodes (attached to the technique), also using filter keys.

When Qt 3D comes to do the render it needs to select the technique based on the available hardware. It will also need to select the technique appropriate to the rendering algorithm that is used. And when it processes each render pass, it will also need to select the appropriate shader based on the render pass. This can be controlled by building a frame graph which QTechniqueFilter nodes and QRenderPassFilter nodes.

You can find a more detailed explanation here.

A common source of “not seeing anything” (or missing some objects) is not providing valid shaders for a specific combination of active technique and current render pass.

In order to help debug this, the new debugging overlay introduced in Qt 3D 5.15 provides a way of dumping the filter state of the scene graph and frame graph which helps understand why some object may not be renderer. It will dump technique details only for the active graphics API (i.e. if you’re running on the desktop, it will not show details relative to OpenGL ES techniques).

For example, here’s a dump of the information for a very simple scene using the default forward renderer:

Active Graphics API: OpenGL 4.1 (Core Profile) (ATI Technologies Inc.)
Render Views:
  1 [ Qt3DExtras::QForwardRenderer  ]
Scene Graph:
  Qt3DCore::Quick::Quick3DEntity{1}
    Qt3DRender::QCamera{13}
    Qt3DExtras::QOrbitCameraController{16}
    Qt3DCore::Quick::Quick3DEntity{75} [ T   ]
    Qt3DCore::Quick::Quick3DEntity{86} [ T   ]

This shows the active technique (desktop OpenGL on macOS); the technique filter used in the frame graph (QForwardRenderer is derived from QTechniqueFilter); the details of which matching techniques are assigned to materials.

So, once you’ve double checked the camera settings, shaders and your model settings, go again and you should be bright as rain!

About KDAB

If you like this blog and want to read similar articles, consider subscribing via our RSS feed.

Subscribe to KDAB TV for similar informative short video content.

KDAB provides market leading software consulting and development services and training in Qt, C++ and 3D/OpenGL. Contact us.

The post Why is my screen black? appeared first on KDAB.

The Qt Company Blog: Qt Creator 4.12 released

$
0
0

We are happy to announce the release of Qt Creator 4.12!

KDAB on Qt: Demos at Qt World Summit 2020

$
0
0

Qt World Summit 2020 in Palm Springs, CA has been postponed and the new date is October 20-22.

KDAB will be Gold Sponsor. Except for 3 one-day training classes, we will also present an array of exciting demos in the KDAB booth. Check them out!

KDAB Demos at Qt World Summit, 2020

Speidels Braumeister

  • UI and process control for a home brewing appliance
  • Rich and intuitive Qt Quick frontend
  • Adapted to cost-effective hardware
  • Yocto-based platform customization
  • KDAB provided full-stack support from BSP to UI effects

Unu Dashboard for electric scooter

  • Navigation framework integrated with Qt Quick scene
  • Speedometer implemented using OpenGL shaders
  • Running on a Yocto-based platform

Watch the video

Download the Case Study

KUESA™ 3D Runtime on i.MX 8M

  • Performance optimized real-time rendering
  • Streamlined integration of 3D content from DCC like Blender
  • Seamless integration into Qt / QML / Qt 3D
  • Intuitive/artistic approach of defining new “Iro Materials”

Watch a tutorial on Kuesa

QiTissue: Big data and image visualizer

  • 2D and 3D visualization from cutting edge clinical diagnostics data sets
  • Efficiently handles gigabytes of data
  • Integrates scientific image processing and analysis
  • Built on top of Qt Widgets, Qt Graphics View, Qt Quick, and Qt 3D
  • Embedded on a Linux Tegra board (3D)

Watch the video…

KDAB Profiling and Analysis Tools

tooling and profiling kdab


New demo coming soon!


The post Demos at Qt World Summit 2020 appeared first on KDAB.

Francesc M. Qt Blog: GitQlient: Multi-platform Git client written with Qt

$
0
0

I'm happy to announce the release of GitQlient 1.0.0.

For the version 1.0.0 I've implemented all the features that were part of GitQlientPlugin with some fixes and improvements. A way more that I initially thought. I've been using GitQlient for the last two weeks in my day-to-day work and I feel it's ready for this first version!

GitQlient: Multi-platform Git client written with Qt first appeared on My C++ & Qt blog - Cesc M..

V-Play Engine: QML Hot Reload: Felgo presents hot new feature at Embedded World 2020!

$
0
0

This year’s Embedded World exhibition & conference has concluded. Felgo attended as Qt Technology Partner at the Qt booth.

Visitors were able to put their hands on one of our hottest new features:QML Hot Reload(pun intended!). Here’s a quick video of the demo right at the booth:


Short live demo of QML Hot Reload at the booth.


Hot Reload with Felgo Live allows you to change your QML & JavaScript source code and view the result in realtime. It applies QML, JavaScript and asset changes instantly on every connected device, on any platform, includingembedded. This reduces the long waiting times for build and deployment steps to only a couple of seconds. 

Hot Reload applies changes in your source code without losing the state of your application. If you are currently working on a sub-page, you will not have to navigate back to it after every change, you will stay exactly where you are in your app.

Stay tuned for the upcoming official announcement of QML Hot Reload with Felgo Live, as part of the upcoming Felgo 3.4.0 update!


Get Started with Felgo for Embedded


The Felgo booth – thank you for stopping by!


The Coronavirus, that just started to spread in northern Italy the week before the show, had a significant impact on the event. Some major exhibitors were missing, and attendance was also significantly down compared to 2019.

Even though the show was smaller than the last few years, it was great to connect & network with our customers, partners and many new people! We’re looking forward to having more conversations in the coming weeks & months on how to support developers with the latest technologies around Felgo, Qt & embedded systems development.

Test the new features now in the Felgo SDK. Download for free today!

The post QML Hot Reload: Felgo presents hot new feature at Embedded World 2020! appeared first on Felgo.

V-Play Engine: How to Handle Safe Area Insets, Notch & Display Cutout for iPhone X, iPad X and Android P – 2020

$
0
0

More and more mobile devices feature a notch (or display cutout, as it is called on Android). To handle this little monster, mobile app developers now face many new challenges.

The trend is spreading fast and many manufacturers already announced new 2018 models with edge-to-edge screens. For example with Android P devices like Essential Phone, OnePlus 6, Oppo R15 Pro, Vivo X21, LG G7, Huawei P20 or Asus Zenfone 5. Similar to the iPhone X, Apple’s new iPad Pro model, the iPad X, will also include a notch and feature Face ID.


How hard can it be to support the notch – maybe one or two days to optimize existing apps for it?


That’s what we initially thought. As it turned out, it was a lot harder than expected. We ran into many bumps along the road of porting 20+ apps & games to properly support it.

As a native iOS and Android developer, you will experience similar issues yourself when you start to develop for devices with edge-to-edge screens. For iOS, Apple even requires you to support iOS 11 and the notch: All new apps & app updates submitted after July 2018 get rejected otherwise.

So we put up our sleeves and prepared this guide to show you how to support the notch in your apps. Thus the sooner you start following this guide the better you are prepared for the Apple change coming in July and for upcoming Android P changes.

The tips provided in this guide apply for both iOS and Android and are useful for cross-platform developers as well. Along the way, we also modified all the components in Felgo, a cross-platform framework for app & game development. It now supports the notch out-of-the-box, so you don’t need to go through this „notch hell“ yourself. 🙂

Looking for Qt Training, Consulting or Software Development?

Here we go! We hope you enjoy the „Ultimate Guide to Survive the Notch“:

User Interface Challenges of Devices with Edge-to-Edge Displays

Many manufacturers already announced new models with edge-to-edge screens, which became even more popular after the release of the iPhone X:

Devices with Edge-to-Edge Screens and a Notch or Display Cutout

Such screens allow to get the most out of the available space the device offers. In addition to the rounded edges, there is a main pain point for mobile app developers: the notch.

iPhone X with Edge-To-Edge Display vs. iPhone 8

Instead of a clear rectangular frame, app developers now face arbitrary shaped screens. Also, hardware buttons at the front no longer exist. They got replaced by on-screen buttons and gestures provided by the OS. The following sections describe how to create adaptive layouts to handle those challenges for both iOS & Android. While this post uses examples for iPhone X, the same concepts and suggested solutions also apply for other devices & platforms with similar screens, like upcoming Android P devices.

Use Felgo’s iOS and Android app development services, in case you need help with that.

Bigger Screen Size and Safe Area of iPhone X

For the iPhone X, the new screen holds two major factors to account for in your mobile app:

  • The screen is bigger in general, so there’s more space your app can use.
  • Your app content should not cover areas with a notch or native on-screen buttons. Otherwise, the elements you place at these parts of the screen are not accessible.

To support different device models and screens, most apps use a responsive layout. This means that the pages use the full height and width to show as much content as possible. This is a good thing. But if the notch and reserved areas are not taken into consideration, some parts of your app are covered or inaccessible.

Full-screen app content gets covered by the notch or on-screen gestures.

In the example screenshots shown above for the iPhone X, the notch covers the top navigation bar in portrait mode and your page content, the list item text, in landscape mode. For both orientations, the area for the home swipe gesture overlays your app at the bottom. Also note that the new screen comes with rounded corners.

To solve this problem, your app needs to consider the safe area of the screen. It is the part of your app, which won’t be covered by the notch or on-screen gestures. The required top and bottom screen insets determine the safe area in portrait mode:

Top and bottom insets determine the safe area in portrait mode.

For example, the navigation bar requires more padding at the top to be within the safe area. In landscape mode it looks a bit different. We then require margins to the left and right (for the rounded corners and the notch), as well as a small inset at the bottom (for the home swipe gesture):

Insets to the left, right and bottom determine the safe area in landscape mode.

How Do Existing Apps Look on iPhone X?

If you are worrying that your published app is already affected by the notch, you can relax. Only apps configured to target iPhone X will run full-screen. Your existing iOS apps will come with black borders as shown on the right in this image, to not overlay areas with a notch or screen gestures:

iOS App with and without iPhone X Support

The disadvantages are that the borders do not look good and the app does not match the style of other iPhone X apps – your user’s will realize this and your app will get a worse rating. The black border fallback is simply a backwards compatibility feature by Apple to not break anything. However, it also means some work for us app developers to support the new screen.

How to Create iPhone X Apps with Xcode

Enable iPhone X Support for Your App

Unless your app enables support for iPhone X, it will show with black borders by default. This also means, that your existing apps won’t be affected by the notch. However, if you want to fully support iPhone X and let your app fill the whole screen, you need to add an additional launch image for the iPhone X resolution in Xcode:

Add new launch images to support iPhone X.

Add one image with 2436 x 1125 pixels for landscape mode, and one with 1125 x 2436 pixels if you want to support portrait.

Position Your Content to the Safe Area Layout Guide

Many iOS apps use a navigation bar at the top and a tab bar at the bottom. With iOS 7, Apple decided to add the topLayoutGuide and bottomLayoutGuide properties, which match the insets for these bars in the view. Developers can thus align their content to match these insets.

For iPhone X, it is not enough to only take care of the top and bottom margins. We also have insets to the left and right of the screen, e.g. when in landscape mode. So Apple introduced the new safeAreaLayoutGuide property with iOS 11. The top and bottom layout guides are now deprecated.

Use the safe area layout guide to align your content with the iPhone X safe area.

To make sure your content isn’t covered by the notch, position it to the safe area layout guide. Similar to the previous top and bottom layout guides, this can be done with constraints.

But this simple solution is still far from perfect. Especially in landscape mode, constraining your content area can leave some ugly margins. To avoid this, you can instead add custom insets to your content only where necessary.

The new safeAreaInsets property gives access to the exact pixel inset for the safe area. You can thus tweak the layout to look exactly as you want. For example, you can design the cells of your list items to account for the safe area with a bigger indent. The view content can then cover the whole screen.

Use safe area insets to optimize your layout for landscape mode.

How to Migrate Existing Native iOS Apps to work with Safe Area Insets

To make updating your apps a bit easier, you have the option to activate the Use Safe Area Layout Guides setting for each of your Storyboards in Xcode.

The Storyboard then replaces the top and bottom layout guides with a safe area and updates the constraints. This is a quick first measure to get your app ready for iPhone X.

But as mentioned above, you will still need to check all your views to provide the best possible user experience. For example, to:

  • Let the background of a sub-view use the full screen while keeping the content safe.
  • Decide how to handle the insets when flicking a UIScrollView.
  • Set up your UITableView or UICollectionView to correctly layout for iPhone X.

Full-screen content vs. optimized layout for iPhone X.

Also, you might not be happy with the result of the default Use Safe Area Layout Guides setting in case your app hides the system status bar:

iPhone X Notch Issue with Hidden StatusBar

Due to a bug within the latest iOS 11 SDK, the navigation bar does not account for the notch in this case. Except for some workarounds, there is no simple solution for this issue at the moment of writing this guide. At least when relying on native iOS development with Xcode.

Android P Developer Preview: Display Cutouts

Many Android phone manufacturers already announced their upcoming device models with edge-to-edge displays and rounded corners. For example:

Upcoming Android Devices with Display Cutout

Google also already released the developer preview for Android P. It comes with the ability to handle these so-called display cutouts. In the iOS world, display cutout is equivalent to notch.

How to Test Apps with Display Cutout in Android P

The Android P Developer Preview allows simulation of display cutout. Android P is available with the SDK Manager of Android Studio. It is sufficient to install the Android P SDK and System Image to test on a virtual Android P device:

The Android P Developer Preview is available with the SDK Manager.

After installation is complete, you can start an emulator running Android P. The developer settings on Android P offer four different display cutout options to choose from:

Android P Developer Settings - Display Cutout Simulation

After selecting this option, the Android device will show with a bigger status bar that also includes a display cutout:

Android P Developer Preview with Simulated Display Cutout

The layoutInDisplayCutoutMode attribute controls how the window is laid out if there is a display cutout. By default your Android P app never extends into cutout areas – with a single exception. As visible on the image above, your app can safely cover the full screen for cutouts that do not exceed the status bar area.

Note: The window will lose this ability to extend into the cutout area when FLAG_FULLSCREEN or SYSTEM_UI_FLAG_FULLSCREEN is set.

To let your app always take advantage of the full screen, you can set the value LAYOUT_IN_DISPLAY_CUTOUT_MODE_ALWAYS. You are then responsible to keep your app content within the safe area of the screen. For example, when the device is in landscape mode or if the cutout exceeds the status bar in portrait.

Custom Layouts with Safe Area Insets in Android P

Like iOS 11, Android P includes features to determine the safe area of the screen and work with the given insets. The new DisplayCutout class lets you find out the location and shape of the non-functional areas where content shouldn’t be displayed.

To determine the existence and placement of the cutouts areas, use the getDisplayCutout() method. You can then access the following fields for the DisplayCutout:

Overall it means quite some work to let your app layout adapt to these new displays. Especially for developers that target both iOS and Android.

Save Time and Effort with Felgo Engine for Mobile Apps

Create iOS and Android Apps that Support The Notches and Display Cutouts

Felgo Engine focuses on making mobile app development easy. And it also supports the iPhone X notch and Android P devices with display cutouts out-of-the-box. You can write your app once, and build for iOS, Android or even Desktop with a single button press from 1 IDE. The source code is 100% shared across all platforms.

Felgo Support for Android P and Display Cutouts

Felgo builds upon C++ & Qt and utilizes QML & JavaScript. QML is a fast and easy-to-use declarative UI language. With only a few lines of code, it is possible to create native iOS and Android apps that look native on every device:

import Felgo 3.0
import QtQuick 2.0

App {
  // adds tab navigation (iOS) or drawer menu (Android) 
  Navigation {

    // first tab
    NavigationItem {
      icon: IconType.home
      title: "Main"

      // main page
      NavigationStack {
        Page {
          title: "Main"

          Rectangle {
            anchors.fill: parent // Rectangle fills whole Page
            color: "lightgreen"

            AppText {
              anchors.centerIn: parent // AppText is centered on Page
              text: "Safe Area"
            }
          }
        }
      }
    }

    // second tab
    NavigationItem {
      icon: IconType.gears
      title: "Settings"

      // settings page
      NavigationStack {
        Page { title: "Settings" }
      }
    }

  }
}


This is how the above example app looks like on an iPhone X:

Felgo Support for iPhone X and the Notch

The used components like Navigation and NavigationStack are prepared to work with safe area insets: They automatically include extra margins for the tab and navigation bar if required.

In contrast to the native iOS SDK it is also possible to hide the status bar without any issues. You can do this by setting a single property in your code:

import Felgo 3.0
import QtQuick 2.0

App {
  onInitTheme: {
    Theme.colors.statusBarStyle = Theme.colors.statusBarStyleHidden
  }

  // main page
  NavigationStack {
    Page {
      title: "Main"

      AppButton {
        anchors.horizontalCenter: parent.horizontalCenter
        text: "Toggle Status Bar"
        onClicked: {
          if(Theme.statusBarStyle !== Theme.colors.statusBarStyleHidden)  
            Theme.colors.statusBarStyle = Theme.colors.statusBarStyleHidden
          else
            Theme.colors.statusBarStyle = Theme.colors.statusBarStyleBlack
        }
      }
    }
  }
}

No status bar issue for iPhone X apps created with Felgo.

The top navigation bar in Felgo always supports the notch automatically, even with a hidden status bar.

Like the Use Safe Area Layout Guide setting for Xcode Storyboards, the content of your pages does not overlap reserved areas of the screen. But Felgo requires no extra setting to achieve this. The page content aligns with the safe area out-of-the box. For devices without a notch, the app does not show any extra margins or insets:

Felgo Components are prepared to support the safe area out-of-the-box.

Note: Configure iPhone X launch images for your iOS app to get full-screen support on iPhone X if you have an existing Felgo app. For new apps, this is set up automatically.

Optimize your User Interface with Adaptive Layouts

For most use cases, the default settings are fine to let your app look good on devices with and without display cutouts. If you want more control over how to display your content, you can disable the useSafeArea setting of each Page. You then have two options to work with the safe area:

  1. Configure only certain content items within the Page to align with the safe area.
  2. Retrieve the exact safe area inset of the screen and layout items as required.

The following example deactivates the useSafeArea setting and shows both options:

import Felgo 3.0
import QtQuick 2.0

App {

  Page {
    useSafeArea: false // the page content can use all available space

    // fill whole page/screen with blue color (background)
    Rectangle {
      anchors.fill: parent
      color: "lightblue"
    }

    // Option 1: fill only safe area with green color (content)
    Rectangle {
      anchors.fill: parent.safeArea
      color: "lightgreen"
    }

    // Option 2: adaptive background to cover top inset area (or status bar area on devices without insets)
    Rectangle {
      width: parent.width
      height: nativeUtils.safeAreaInsets.top > 0 ? nativeUtils.safeAreaInsets.top : nativeUtils.statusBarHeight()
      color: "yellow"
    }
  }

}


The page content can now cover the full screen by default. You can use the safeArea property of the Page to align items with the safe area of the screen. In the above example, we use this to fill the safe area with a green rectangle. This is where you can place your content items.

The nativeUtils.safeAreaInsets hold the exact safe area insets of the screen in pixels. Devices without a notch do not have any insets and thus return 0. For iPhone X, the yellow rectangle will cover the top inset, which includes the status bar. To also support older devices, you fill the status bar if no inset is returned by nativeUtils.safeAreaInsets.top.

The available safeAreaInsets properties are:

  • nativeUtils.safeAreaInsets.top
  • nativeUtils.safeAreaInsets.right
  • nativeUtils.safeAreaInsets.bottom
  • nativeUtils.safeAreaInsets.left

Running this app on iOS or Android produces the following result:

Create adaptive layouts to perfectly support the notch or display cutouts in your apps.

Developing adaptive user interfaces this way is very convenient. The following example shows how you could use nativeUtils.safeAreaInsets.left to add more indent for the cells of a list.

import Felgo 3.0
import QtQuick 2.0

App {

  NavigationStack {
    ListPage {
      title: "List Page"
      useSafeArea: false // the page fills all available space
      model: 50 // quick way to populate the list with 50 items

      // UI for cells of the list
      delegate: SimpleRow {
        text: "Item #"+index

        // set indent of the cells
        // matches the safe area inset or minimum 16 dp (if no inset required, e.g. in portrait mode or on older devices)
        style.indent: Math.max(nativeUtils.safeAreaInsets.left, dp(16))
      }
    }
  }
  
}

With such simple additions, you can make sure that your app looks pixel-perfect on screens with and without safe area insets.

Adaptive Layout Example: Full-width list cells in landscape mode.

You don’t need to add such tweaks for apps that offer the default UI with a navigation bar and tab bar. The Felgo page and navigation components look good on all devices and adapt their style automatically.

Support for Display Cutout on Android P Devices

Felgo Engine is a cross-platform development tool that supports both Android and iOS. You can take the QML code of your iOS app and directly build for Android, or vice-versa. All components change their look and behavior then. They match the native style and user experience of the given platform:

Felgo Supports both iOS 11 and Android P.

The above image shows the Android and iOS style for the same example app. The Android style is already prepared to support edge-to-edge screens. No extra work is required, to make your app work cross-platform for iOS & Android with display cutouts, safe area and a notch!

Simulate Safe Area Insets while Developing on Desktop

It takes quite some time to always build and deploy to your phone or the simulator. With Felgo you can run and test your app directly on Desktop. It is even possible to simulate different devices and resolutions to see how your app will look like. You can change the resolution at runtime, without having to restart your app. This is a huge time-saver for UI development & testing! Native development for Android or iOS requires deployment to another real or virtual device to test the UI.

Felgo Device Resolution Simulation on Desktop

Along with the support for a display notch, Felgo also comes with a new resolution simulator entry for iPhone X. And the best thing is: It even covers the safe area insets you get on a real device:

iPhone X Desktop Simulation with Safe Area Insets

Felgo Engine is thus a huge time-saver when developing for iOS and Android. The Felgo SDK is free to use, so make sure to check it out!

If you need help with your mobile app development, use Felgo’s consulting and app development services.

More Relevant App Development Resources

The Best App Development Tutorials & Free App Templates

All of these tutorials come with full source code of the mobile apps! You can copy the code to make your own apps for free!

App Development Video Tutorials


Thanks for reading & scrolling that far! 🙂

Do you have suggestions for posts or tutorials about app development?
Simply send us a message which tutorial you’d like to see here.


More Posts Like This

feature
How to Make Cross-Platform Mobile Apps with Qt – Felgo Apps

teaser-iphonex-support-and-runtime-screen-orientation-change-705px
Release 2.16.0: iPhone X Support and Runtime Screen Orientation Changes

How to Expose a Qt C++ Class with Signals and Slots to QML

The post How to Handle Safe Area Insets, Notch & Display Cutout for iPhone X, iPad X and Android P – 2020 appeared first on Felgo.

V-Play Engine: Release 3.4.0: QML Hot Reload with Felgo Live

$
0
0

Felgo 3.4.0 introduces QML Hot Reload to cut the waiting times to build, deploy and iterate on Qt and Felgo projects.

Hot Reload with Felgo Live allows you to change your QML & JavaScript source code and view the result in realtime. It applies QML, JavaScript and asset changes instantly on every connected device, immediately after saving. This reduces the long waiting times for build and deployment steps to only a couple of seconds.

Hot Reload applies changes in your source code without losing the state of your application. If you are currently working on a sub-page, you will not have to navigate back to it after every change, you will stay exactly where you are in your app.

You can also test your projects on mobile, without installing native mobile SDKs, only by installing the Felgo Live App on your device. Hot Reload even works on embedded devices!


Hot Reload can be used with Felgo and also pure Qt projects, on any platform. Hot Reload is available for any Felgo user, including the free Personal license.

Try Hot Reload Now

Hot Reloading for QML, JavaScript and Assets

Hot Reload keeps your application running while it applies code changes. This means your app or game keeps its exact state when reloading. This helps speed up development even more than with live reloading.

Incremental UI building

You can build your user interface incrementally while navigating it at the same time, and iterate on any sub-page without navigating to it repeatedly. You can add navigation items, pages and sub pages and modify their content and immediately see the outcome on multiple platforms.

Work on a single screen until it is pixel perfect, without ever leaving it. Felgo Live will fully preserve the application state and apply the change directly in your running app. No need to navigate back to the sub-page or popup that you are currently working on after each change.

Define interaction seamlessly

Hot Reload also allows you to add any form of interaction to the running QML application. You can add property bindings, signal handlers and regular JavaScript functions at any point to the QML tree. The new definitions are effective immediately.

Support for Custom C++ and Native Code

If your application contains any custom C++ code, native code, additional libraries or any Qt module that is not already pre-configured with the default Live Client app, you can make use of the Live Client Module.

This C++ module can be added to your own project with 3 lines of code. This will enhance your own application with Hot Reload features. Just build it normally for any desired platform and connect it to your Live Server, just like the default Live Client.

You can find more information about the Live Client Module in the documentation.

How to Use Hot Reloading with Felgo Live

You can find a detailed guide in the documentation. Here is a short summary of the steps.

Note: If you already use Live Reloading, just update Felgo and your Live Client apps and you are ready to go.

After installing/updating Felgo, if you open a project in Qt Creator, the Felgo Live Server will automatically start. You can also manually start the Live Server using the “Live Run” button, the green triangle with “LIVE” in Qt Creator.

Depending on your autostart setting of the Desktop Live Client, you will also see the Felgo Live Client application start. You can also start the Live Client for Desktop with the start button in your Live Server.

The Live Server is watching for changes in your source code, and pushes the changes to the Live Client, which will display your application.

You can also connect your mobile device to the Live Server. Just download the Felgo Live Scripting app for iOS or Android directly on your device, click connect, and accept the request in your Live Server. Every code change will then be displayed on any connected device at the same time.

The new Hot Reload feature can also be disabled, to only use Live Reloading instead. This can be helpful if you experience any issue with your specific setup, or Hot Reloading is not desired for any reason. A full reload can also be triggered at any time.

Please refer to the documentation for more details.

How does Hot Reload with Felgo Live Work?

You will be able to get a closer look at how Hot Reloading works soon, in another blog post. For those who can’t wait, there are also some insights in the documentation.

UPDATE: Here is the new post with many details about how QML Hot Reload works and why you should use it: QML Hot Reload with Felgo Live for Qt

Firebase Authentication using your Google/Gmail Account

With Felgo 3.4.0 you can now also let your users log in to Firebase with their Google/Gmail account, with the new loginUserWithGoogle() method.

More Features, Improvements and Fixes

Felgo 3.4.0 includes many more features, for example:

  • OneSignal::notificationReceived() now provides information about the push notification’s action buttons.
  • NativeUtils::contacts now contains more information about contacts. The new information includes postal addresses, email addresses, company name and phone number types.
  • The Facebook Plugin now supports the native SDK v5.13.0 on iOS.
  • Examples now use the latest project format of Felgo, which allows you to provide more configuration values, like the license key, from your *.pro file.
  • NativeUtils::displayImagePicker() no longer leaves behind a temporary file on iOS.
  • Fixes the Deprecated API Usage warning for UIWebView when uploading an app to the iOS App Store.
  • Fixes an Android SSL version issue while building, which previously required you to apply a hotfix.
  • Fixes a crash with the OneSignal requestTags method.
  • Fixes an issue with Android 10 API blacklisting.

For all relevant changes, features and fixes of recent Felgo updates, please check out the changelog.

How to Update Felgo

Test out these new features by following these steps:

  • Open the Felgo SDK Maintenance Tool in your Felgo SDK directory.
  • Choose “Update components” and finish the update process to get this release as described in the Felgo Update Guide.

Update Felgo

If you haven’t installed Felgo yet, you can do so now with the latest installer from here. Now you can explore all of the new features included in this release!

For a full list of improvements and fixes to Felgo in this update, please check out the change log!


More Posts Like This


Release 3.3.0: Update to Qt 5.13.2 and Qt Creator 4.10.2, Jira Tima App Demo

Release-3-2-0-Qt-5123-EcmaScript7-QtCreator-482
Release 3.2.0: Update to Qt 5.12.3 with ECMAScript 7, Subscriptions, Image Picker and Qt Creator 4.8.2


Release 3.1.0: New Felgo Plugins Version, Unified App Configuration and FlickablePage

The post Release 3.4.0: QML Hot Reload with Felgo Live appeared first on Felgo.


Latest from LearnPyQt: MooseAche

$
0
0

MooseAche is the latest revolution in web browsing! Go back and forward! Save files! Get help! (you'll need it). Any similarity to other browsers is entirely coincidental.

QtWebEngineWidgets is not included in the main PyQt5 repository. If you see errors when running this relating to this module, you can install it using pip install PyQtWebEngine

The full source code for MooseAche is available in the 15 minute apps repository. You can download/clone to get a working copy, then install requirements using:

pip3 install -r requirements.txt

You can then run MooseAche with:

python3 browser.py

Read on for a walkthrough of how the code works.

The browser widget

The core of our browser is the QWebView which we import from PyQt5. QtWebEngineWidgets. This provides a complete browser window, which handles the rendering of the downloaded pages.

Below is the bare-minimum of code required to use web browser widget in PyQt.

fromPyQt5.QtCoreimport*fromPyQt5.QtWidgetsimport*fromPyQt5.QtGuiimport*fromPyQt5.QtWebEngineWidgetsimport*importsysclassMainWindow(QMainWindow):def__init__(self,*args,**kwargs):super(MainWindow,self).__init__(*args,**kwargs)self.browser=QWebEngineView()self.browser.setUrl(QUrl("http://www.google.com"))self.setCentralWidget(self.browser)self.show()app=QApplication(sys.argv)window=MainWindow()app.exec_()

If you click around a bit you'll discover that the browser behaves as expected — links work correctly, and you can interact with the pages. However, you'll also notice things you take for granted are missing — like an URL bar, controls or any sort of interface whatsoever. This makes it a little tricky to use.

To convert this bare-bones browser into something usable we can add some controls, as a series of QActions on a QToolbar. We add these definitions to the __init__ block of the QMainWindow.

navtb=QToolBar("Navigation")navtb.setIconSize(QSize(16,16))self.addToolBar(navtb)back_btn=QAction(QIcon(os.path.join('icons','arrow-180.png')),"Back",self)back_btn.setStatusTip("Back to previous page")back_btn.triggered.connect(self.browser.back)navtb.addAction(back_btn)

The QWebEngineView includes slots for forward, back and reload navigation, which we can connect to directly to our action's .triggered signals.

next_btn=QAction(QIcon(os.path.join('icons','arrow-000.png')),"Forward",self)next_btn.setStatusTip("Forward to next page")next_btn.triggered.connect(self.browser.forward)navtb.addAction(next_btn)reload_btn=QAction(QIcon(os.path.join('icons','arrow-circle-315.png')),"Reload",self)reload_btn.setStatusTip("Reload page")reload_btn.triggered.connect(self.browser.reload)navtb.addAction(reload_btn)home_btn=QAction(QIcon(os.path.join('icons','home.png')),"Home",self)home_btn.setStatusTip("Go home")home_btn.triggered.connect(self.navigate_home)navtb.addAction(home_btn)

While forward, back and reload can use built-in slots to perform their actions, the navigate home button requires a custom slot function. The slot function is defined on our QMainWindow class, and simply sets the URL of the browser to the Google homepage. Note that the URL must be passed as a QUrl object.

defnavigate_home(self):self.browser.setUrl(QUrl("http://www.google.com"))

Any decent web browser also needs an URL bar, and some way to stop the navigation.

self.httpsicon=QLabel()# Yes, really!self.httpsicon.setPixmap(QPixmap(os.path.join('icons','lock-nossl.png')))navtb.addWidget(self.httpsicon)self.urlbar=QLineEdit()self.urlbar.returnPressed.connect(self.navigate_to_url)navtb.addWidget(self.urlbar)stop_btn=QAction(QIcon(os.path.join('icons','cross-circle.png')),"Stop",self)stop_btn.setStatusTip("Stop loading current page")stop_btn.triggered.connect(self.browser.stop)navtb.addAction(stop_btn)

As before the 'stop' functionality is available as a slot on the QWebEngineView itself, and we can simply connect the .triggered signal from the stop button to the existing slot. However, other features of the URL bar we must handle independently.

First we add a QLabel to hold our SSL or non-SSL icon to indicate whether the page is secure. Next, we add the URL bar which is simply a QLineEdit. To trigger the loading of the URL in the bar when entered (return key pressed) we connect to the .returnPressed signal on the widget to drive a custom slot function to trigger navigation to the specified URL.

defnavigate_to_url(self):# Does not receive the Urlq=QUrl(self.urlbar.text())ifq.scheme()=="":q.setScheme("http")self.browser.setUrl(q)

We also want the URL bar to update in response to page changes. To do this we can use the .urlChanged and .loadFinished signals from the QWebEngineView. We set up the connections from the signals in the __init__ block as follows:

self.browser.urlChanged.connect(self.update_urlbar)self.browser.loadFinished.connect(self.update_title)

Then we define the target slot functions which for these signals. The first, to update the URL bar accepts a QUrl object and determines whether this is a http or https URL, using this to set the SSL icon.

This is a terrible way to test if a connection is 'secure'. To be correct we should perform a certificate validation.

The QUrl is converted to a string and the URL bar is updated with the value. Note that we also set the cursor position back to the beginning of the line to prevent the QLineEdit widget scrolling to the end.

defupdate_urlbar(self,q):ifq.scheme()=='https':# Secure padlock iconself.httpsicon.setPixmap(QPixmap(os.path.join('icons','lock-ssl.png')))else:# Insecure padlock iconself.httpsicon.setPixmap(QPixmap(os.path.join('icons','lock-nossl.png')))self.urlbar.setText(q.toString())self.urlbar.setCursorPosition(0)

It's also a nice touch to update the title of the application window with the title of the current page. We can get this via browser.page().title() which returns the contents of the tag in the currently loaded web page.

defupdate_title(self):title=self.browser.page().title()self.setWindowTitle("%s - Mozarella Ashbadger"%title)

File operations

A File menu was added with self.menuBar().addMenu("&File") assigning the F key as a Alt-shortcut. Once we have the menu object, we can can add QAction objects to it to create the entries. We create two basic entries here for opening and saving HTML files (from a local disk). These both require custom slot method.

file_menu=self.menuBar().addMenu("&File")open_file_action=QAction(QIcon(os.path.join('icons','disk--arrow.png')),"Open file...",self)open_file_action.setStatusTip("Open from file")open_file_action.triggered.connect(self.open_file)file_menu.addAction(open_file_action)save_file_action=QAction(QIcon(os.path.join('icons','disk--pencil.png')),"Save Page As...",self)save_file_action.setStatusTip("Save current page to file")save_file_action.triggered.connect(self.save_file)file_menu.addAction(save_file_action)````Theslotmethodforopeningafileusesthebuilt-in`QFileDialog.getOpenFileName()`methodtocreateafile-opendialogandgetaname.Werestrictthenamesbydefaulttofilesmatching`\*.htm`or`*.html`.Wereadthefileintoavariable`html`usingstandardPythonfunctions,thenuse`.setHtml()`toloadtheHTMLintothebrowser.```pythondefopen_file(self):filename,_=QFileDialog.getOpenFileName(self,"Open file","","Hypertext Markup Language (*.htm *.html);;""All files (*.*)")iffilename:withopen(filename,'r')asf:html=f.read()self.browser.setHtml(html)self.urlbar.setText(filename)

Similarly to save the HTML from the current page, we use the built-in QFileDialog.getSaveFileName() to get a filename. However, this time we get the HTML from self.browser.page().toHtml() and write it to the selected filename. Again we use standard Python functions for the file handler.

defsave_file(self):filename,_=QFileDialog.getSaveFileName(self,"Save Page As","","Hypertext Markup Language (*.htm *html);;""All files (*.*)")iffilename:html=self.browser.page().toHtml()withopen(filename,'w')asf:f.write(html)

Help

Finally, to complete the standard interface we can add a Help menu. We add two custom slot methods to handle the display of the dialog, and to load the 'browser page' with more information.

help_menu=self.menuBar().addMenu("&Help")about_action=QAction(QIcon(os.path.join('icons','question.png')),"About Mozarella Ashbadger",self)about_action.setStatusTip("Find out more about Mozarella Ashbadger")# Hungry!about_action.triggered.connect(self.about)help_menu.addAction(about_action)navigate_mozarella_action=QAction(QIcon(os.path.join('icons','lifebuoy.png')),"Mozarella Ashbadger Homepage",self)navigate_mozarella_action.setStatusTip("Go to Mozarella Ashbadger Homepage")navigate_mozarella_action.triggered.connect(self.navigate_mozarella)help_menu.addAction(navigate_mozarella_action)

The first method navigate_mozzarella opens up a page with more information on the browser, the second creates and executes a custom QDialog class AboutDialog.

defnavigate_mozarella(self):self.browser.setUrl(QUrl("https://martinfitzpatrick.name/create-simple-gui-applications"))defabout(self):dlg=AboutDialog()dlg.exec_()

The definition for the about dialog is given below. The structure follows that seen earlier in the book, with a QDialogButtonBox and associated signals to handle user input, and a series of QLabels to display the application information and a logo.

The only trick here is adding all the elements to the layout, then iterate over them to set the alignment to the center in a single loop. This saves duplication for the individual sections.

classAboutDialog(QDialog):def__init__(self,*args,**kwargs):super(AboutDialog,self).__init__(*args,**kwargs)QBtn=QDialogButtonBox.Ok# No cancelself.buttonBox=QDialogButtonBox(QBtn)self.buttonBox.accepted.connect(self.accept)self.buttonBox.rejected.connect(self.reject)layout=QVBoxLayout()title=QLabel("Mozarella Ashbadger")font=title.font()font.setPointSize(20)title.setFont(font)layout.addWidget(title)logo=QLabel()logo.setPixmap(QPixmap(os.path.join('icons','ma-icon-128.png')))layout.addWidget(logo)layout.addWidget(QLabel("Version 23.35.211.233232"))layout.addWidget(QLabel("Copyright 2015 Mozarella Inc."))foriinrange(0,layout.count()):layout.itemAt(i).setAlignment(Qt.AlignHCenter)layout.addWidget(self.buttonBox)self.setLayout(layout)

Further ideas

If you're looking for a browser which supports tabbed browsing, check out Mozzarella Ashbadger. This is based on this same code, but with the addition of tabs, and using signal-redirection to route behaviours based on the active tabs.

tHeBloG: Qt Quick 3D DynamicMeters demo

$
0
0

Lately we have been working to perfect the Qt Quick 3D for the 5.15 release. There are still some tweaking to do, but things are looking pretty nice already!


In order to prove (to ourselves and to others) that Quick 3D is ready for the prime time, we have also been implementing some demos with it. Tomi already made a blog post about Quick 3D Benchmarking demo here, go check it out if you haven't already. This benchmarking application can be used to test many features of Quick 3D and to evaluate how different hardware can handle the load when the model count, complexity, texture sizes etc. are increased.

Another demo we have prepared is called DynamicMeters. The main targets of this demo were:
  • Demonstrate how Quick 3D and Qt Quick (2D) can easily be combined into single UX. While 3D is great, most applications want to combine also traditional 2D elements in different ways.
  • Test how Quick 3D works together with 3rd party OpenGL libraries. Make sure that the performance is good and there are no barriers for this approach.
  • Implement Qt Quick components as mostly dynamically painted. Usually these kinds of user interfaces use images, but painting them instead allows for more customization and possibilities for nice transition animations. Also it keeps storage requirements low: Currently the whole demo requires under 5MB space, a big part of it going for QNanoPainter built-in Roboto fonts. Not all of them are even used so this could be lightened even more if desired.
Here is a brief video showing the main features of the demo:


For those who want to know a bit more, here are few implementation details:
  • Running the demo requires very latest Qt Quick 3D 5.15 branch. Beta4 doesn't yet contain all the latest fixes, so either build Quick 3D from sources or wait for the release candidate / final 5.15 packages.
  • The demo has been tested on Windows, macOS, and embedded Linux. If you have trouble building it for some embedded device, make sure the correct QNanoPainter backend get selected in libqnanopainter/include.pri
  • To combine 2D Qt Quick items into Quick 3D scene we use this kind of approach:

  • Model{
    source:"#Rectangle"
    scale:Qt.vector3d(4,4,1)
    materials:DefaultMaterial{
    diffuseMap:Texture{
    sourceItem:Item{
    // Any Qt Quick content here..
    }
    }
    }
    }

    This allows plenty of customization possibilities with the DefaultMaterial properties. Alternatively, if you want to embed 2D elements so that they are rendered in 3D space but are not affected by Quick 3D lights etc. that can be done even easier like this:

    Node{
    position:Qt.vector3d(10,20,30)
    Item{
    // Any Qt Quick content here..
    }
    }

  • To keep the painting inside the meter circles, demo uses masking ShaderEffect with a fragment shader like this:

  • varyinghighpvec2qt_TexCoord0;
    uniformsampler2Dsrc;
    uniformlowpfloatqt_Opacity;
    voidmain(){
    lowpvec2c=vec2(0.5,0.5);
    if(distance(c,qt_TexCoord0)<0.5){
    gl_FragColor=texture2D(src,qt_TexCoord0)*qt_Opacity;
    }else{
    gl_FragColor=vec4(0.0,0.0,0.0,0.0);
    }
    }

    Now you may be askig that shouldn't we use smoothstep to not get annoying aliased outlines? Excellent question, yes we should if our application wouldn't contain 3D ring meshes which hide these outlines. For the optimal performance, remember to avoid all extra work ;-)
  • For painting the components demo uses mostly the QNanoPainter library. QNanoPainter performs well with both OpenGL and OpenGL ES, and offers smooth vertex antialiasing which makes it a good match for the dynamic meters. The default settings can be reseted by long pressing the view and this UI overlay is implemented using Qt Quick Shape element. Shape is perfect for this kind of painting, no C++ is required and all painting & animating can be done within QML.
The DynamicMeters demo source codes can be downloaded from https://git.qt.io/public-demos/qtquick3d/ so please check it out and give Qt Quick 3D a spin!

KDAB on Qt: Debugging and Profiling Qt 3D applications

$
0
0

Qt 3D, being a retained mode high level graphic API abstraction, tries to hide most of the details involved in rendering the data provided by applications. It makes a lot of decisions and operations in the background in order to get pixels on the screen. But, because Qt 3D also has very rich API, developers can have a lot of control on the rendering by manipulating the scene graph and, more importantly, the frame graph. It is however sometimes difficult to understand how various operations affect performance.

In this article, we look at some of the tools, both old and new, that can be used to investigate what Qt 3D is doing in the back end and get some insight into what is going on during the frame.


Built in Profiling

The first step in handling performance issues is, of course, measuring where time is spent. This can be as simple as measuring how long it took to render a given frame. But to make sense of these numbers, it helps to have a notion of how complex the scene is.

In order to provide measurable information, Qt 3D introduces a visual overlay that will render details of the scene, constantly updated in real time.


The overlay shows some real time data:

  • Time to render last frame and FPS (frames per second), averaged and plotted over last few seconds. As Qt 3D is by default locking to VSync, this should not exceed 60fps on most configurations.
  • Number of Jobs: these are the tasks that Qt 3D executes on every frame. The number of jobs may vary depending on changes in the scene graph, whether animations are active, etc.
  • Number of Render Views: this matches loosely to render pass, see below discussion on the frame graph.
  • Number of Commands: this is total number of draw calls (and compute calls) in the frame.
  • Number of Vertices and Primitives (triangles, lines and points combined).
  • Number of Entities, Geometries and Textures in the scene graph. For the last two, the overlay will also show the number of geometries and textures that are effectively in use in the frame.

As seen in the screen shots above, the scene graph contains two entities, each with one geometry. This will produce two draw calls when both objects are in frame. But as the sphere rotates out of the screen, you can see the effect of the view frustum culling job which is making sure the sphere doesn’t get rendered, leaving a single draw call for the torus.

This overlay can be enabled by setting the showDebugOverlay property of the QForwardRenderer to true.


Understanding Rendering Steps

To make sense of the numbers above, it helps to understand the details of the scene graph and frame graph.

In the simple case, as in the screen shots, an entity will have a geometry (and material, maybe a transform). But many entities may share the same geometry (a good thing if appropriate!). Also, entities may not have any geometry but just be used for grouping and positioning purposes.

So keeping an eye on the number of entities and geometries, and seeing how that effects the number of commands (or draw calls), is valuable. If you find one geometry drawn one thousand times in a thousand separate entities, if may be a good indication that you should refactor your scene to use instanced rendering.

In order to provide more details, the overlay has a number of buttons that can be used to dump the current state of the rendering data.

For a deeper understanding of this, you might consider our full Qt 3D Training course.

Scene Graph

Dumping the scene graph will print data to the console, like this:

Qt3DCore::Quick::Quick3DEntity{1} [ Qt3DRender::QRenderSettings{2}, Qt3DInput::QInputSettings{12} ]
  Qt3DRender::QCamera{13} [ Qt3DRender::QCameraLens{14}, Qt3DCore::QTransform{15} ]
  Qt3DExtras::QOrbitCameraController{16} [ Qt3DLogic::QFrameAction{47}, Qt3DInput::QLogicalDevice{46} ]
  Qt3DCore::Quick::Quick3DEntity{75} [ Qt3DExtras::QTorusMesh{65}, Qt3DExtras::QPhongMaterial{48},
                                       Qt3DCore::QTransform{74} ]
  Qt3DCore::Quick::Quick3DEntity{86} [ Qt3DExtras::QSphereMesh{76}, Qt3DExtras::QPhongMaterial{48}, 
                                       Qt3DCore::QTransform_QML_0{85} ]

This prints the hierarchy of entities and for each of them lists all the components. The id (in curly brackets) can be used to identify shared components.

Frame Graph

Similar data can be dumped to the console to show the active frame graph:

Qt3DExtras::QForwardRenderer
  Qt3DRender::QRenderSurfaceSelector
    Qt3DRender::QViewport
      Qt3DRender::QCameraSelector
        Qt3DRender::QClearBuffers
          Qt3DRender::QFrustumCulling
            Qt3DRender::QDebugOverlay

This is the default forward renderer frame graph that comes with Qt 3D Extras.

As you can see, one of the nodes in that graph is of type QDebugOverlay. If you build your own frame graph, you can use an instance of that node to control which surface the overlay will be rendered onto. Only one branch of the frame graph may contain a debug node. If the node is enabled, then the overlay will be rendered for that branch.

The frame graph above is one of the simplest you can build. They may get more complicated as you build effects into your rendering. Here’s an example of a Kuesa frame graph:

Kuesa::PostFXListExtension
  Qt3DRender::QViewport
    Qt3DRender::QClearBuffers
      Qt3DRender::QNoDraw
    Qt3DRender::QFrameGraphNode (KuesaMainScene)
      Qt3DRender::QLayerFilter
        Qt3DRender::QRenderTargetSelector
          Qt3DRender::QClearBuffers
            Qt3DRender::QNoDraw
          Qt3DRender::QCameraSelector
            Qt3DRender::QFrustumCulling
              Qt3DRender::QTechniqueFilter
                Kuesa::OpaqueRenderStage (KuesaOpaqueRenderStage)
                  Qt3DRender::QRenderStateSet
                    Qt3DRender::QSortPolicy
            Qt3DRender::QTechniqueFilter
              Kuesa::OpaqueRenderStage (KuesaOpaqueRenderStage)
                Qt3DRender::QRenderStateSet
                  Qt3DRender::QSortPolicy
            Qt3DRender::QFrustumCulling
              Qt3DRender::QTechniqueFilter
                Kuesa::TransparentRenderStage (KuesaTransparentRenderStage)
                  Qt3DRender::QRenderStateSet
                    Qt3DRender::QSortPolicy
            Qt3DRender::QTechniqueFilter
              Kuesa::TransparentRenderStage (KuesaTransparentRenderStage)
                Qt3DRender::QRenderStateSet
                  Qt3DRender::QSortPolicy
          Qt3DRender::QBlitFramebuffer
            Qt3DRender::QNoDraw
    Qt3DRender::QFrameGraphNode (KuesaPostProcessingEffects)
      Qt3DRender::QDebugOverlay
        Qt3DRender::QRenderStateSet (ToneMappingAndGammaCorrectionEffect)
          Qt3DRender::QLayerFilter
            Qt3DRender::QRenderPassFilter

If you are not familiar with the frame graph, it is important to understand that each path (from root to leaf) will represent a render pass. So the simple forward renderer will represent a simple render pass, but the Kuesa frame graph above contains eight passes!

It is therefore often easier to look at the frame graph in term of those paths. This can also be dumped to the console:

[ Kuesa::PostFXListExtension, Qt3DRender::QViewport, Qt3DRender::QClearBuffers, Qt3DRender::QNoDraw ]
[ Kuesa::PostFXListExtension, Qt3DRender::QViewport, Qt3DRender::QFrameGraphNode (KuesaMainScene),
  Qt3DRender::QLayerFilter, Qt3DRender::QRenderTargetSelector, Qt3DRender::QClearBuffers, Qt3DRender::QNoDraw ]
[ Kuesa::PostFXListExtension, Qt3DRender::QViewport, Qt3DRender::QFrameGraphNode (KuesaMainScene), 
  Qt3DRender::QLayerFilter, Qt3DRender::QRenderTargetSelector, Qt3DRender::QCameraSelector, Qt3DRender::QFrustumCulling, 
  Qt3DRender::QTechniqueFilter, Kuesa::OpaqueRenderStage (KuesaOpaqueRenderStage), Qt3DRender::QRenderStateSet, 
  Qt3DRender::QSortPolicy ]
[ Kuesa::PostFXListExtension, Qt3DRender::QViewport, Qt3DRender::QFrameGraphNode (KuesaMainScene), 
  Qt3DRender::QLayerFilter, Qt3DRender::QRenderTargetSelector, Qt3DRender::QCameraSelector, Qt3DRender::QTechniqueFilter, 
  Kuesa::OpaqueRenderStage (KuesaOpaqueRenderStage), Qt3DRender::QRenderStateSet, Qt3DRender::QSortPolicy ]
[ Kuesa::PostFXListExtension, Qt3DRender::QViewport, Qt3DRender::QFrameGraphNode (KuesaMainScene),
  Qt3DRender::QLayerFilter, Qt3DRender::QRenderTargetSelector, Qt3DRender::QCameraSelector, Qt3DRender::QFrustumCulling,
  Qt3DRender::QTechniqueFilter, Kuesa::TransparentRenderStage (KuesaTransparentRenderStage), Qt3DRender::QRenderStateSet,
  Qt3DRender::QSortPolicy ]
[ Kuesa::PostFXListExtension, Qt3DRender::QViewport, Qt3DRender::QFrameGraphNode (KuesaMainScene),
  Qt3DRender::QLayerFilter, Qt3DRender::QRenderTargetSelector, Qt3DRender::QCameraSelector, Qt3DRender::QTechniqueFilter,
  Kuesa::TransparentRenderStage (KuesaTransparentRenderStage), Qt3DRender::QRenderStateSet, Qt3DRender::QSortPolicy ]
[ Kuesa::PostFXListExtension, Qt3DRender::QViewport, Qt3DRender::QFrameGraphNode (KuesaMainScene),
  Qt3DRender::QLayerFilter, Qt3DRender::QRenderTargetSelector, Qt3DRender::QBlitFramebuffer, Qt3DRender::QNoDraw ]

Hopefully this is a good way of finding out issues you may have when building your custom frame graph.

Draw Commands

On every pass of the frame graph, Qt 3D will traverse the scene graph, find entities that need to be rendered, and for each of them, issue a draw call. The number of objects drawn in each pass may vary, depending on whether the entities and all of their components are enabled or not, or whether entities get filtered out by using QLayers (different passes may draw different portions of the scene graph).

The new profiling overlay also gives you access to the actual draw calls.

So in this simple example, you can see that two draw calls are made, both for indexed triangles. You can also see some details about the render target, such as the viewport, the surface size, etc.

That information can also be dumped to the console which makes it easier to search in a text editor.


Built in Job Tracing

The data above provides a useful real time view on what is actually being processed to render a particular frame. However, it doesn’t provide much feedback as to how long certain operations take and how that changes during the runtime of the application.

In order to track such information, you need to enable tracing.

Tracing tracks, for each frame, what jobs are executed by Qt 3D’s backend. Jobs involve updating global transformations and the bounding volume hierarchy, finding objects in the view frustum, layer filtering, picking, input handling, animating, etc. Some jobs run every frame, some only run when internal state needs updating.

If your application is slow, it may be because jobs are taking a lot of time to complete. But how do you find out which jobs take up all the time?

Qt 3D has had tracing built in since a few years already, but it was hard to get to. You needed to do your own build of Qt 3D and enable tracing when running qmake. From thereon, every single run of an application linked against that build of Qt 3D would generate a trace file.

In 5.15, tracing is always available. It can be enabled in two ways:

  • By setting the QT3D_TRACE_ENABLED environment variable before the application starts (or at least before the aspect engine is created). This means the tracing will happen for the entire run of the application.
  • If you’re interested in tracing for a specific part of your application’s life time, you can enable the overlay and toggle tracing on and off using the check for Jobs. In this case, a new trace file will be generated every time the tracing is enabled.

For every tracing session, Qt 3D will generate one file in the current working directory. So how do you inspect the content of that file?

KDAB provides a visualisation tool but it is not currently shipped with Qt 3D. You can get the source and build it from GitHub here. Because jobs change from one version of Qt 3D to the next, you need to take care to configure which version was used to generate the trace files. Using that tool, you can open the trace files. It will render a time line of all the jobs that were executed for every frame.

In the example above, you can see roughly two frames worth of data, with jobs executed on a thread pool. You can see the longer running jobs, in this case:

  • RenderViewBuilder jobs, which create all the render views, one for each branch in the frame graph. You can see some of them take much longer that others.
  • FrameSubmissionPart1 and FrameSubmissionPart2 which contain the actual draw calls.

Of course, you need to spend some time understanding what Qt 3D is doing internally to make sense of that data. As with most performance monitoring tools, it’s worth spending the time experimenting with this and seeing what gets affected by changes you make to your scene graph or frame graph.

Job Dependencies

Another important source of information when analysing performance of jobs is looking at the dependencies. This is mostly useful for developers of Qt 3D aspects.

Using the profiling overlay, you can now dump the dependency graph in GraphViz dot format.

Other Tools

Static capabilities

Qt 3D 5.15 introduces QRenderCapabilities which can be used to make runtime decisions based on the actual capabilities of the hardware the application is running on. The class supports a number of properties which report information such as the graphics API in use, the card vendor, the supported versions of OpenGL and GLSL. It also has information related to the maximum number of samples for MSAA, maximum texture size, if UBOs and SSBOs are supported and what their maximum size is, etc.

Third Party Tools

Of course, using more generic performance tools is also a good idea.

perf can be used for general tracing, giving you insight where time is spent, both for Qt 3D and for the rest of your application. Use it in combination with KDAB’s very own hotspot to get powerful visualisation of the critical paths in the code.

Using the flame graph, as show above (captured on an embedded board), you can usually spot the two main sections of Qt 3D work, the job processing and the actual rendering.

Other useful tools are the OpenGL trace capture applications, either the generic ones such as apitrace and renderdoc, or the ones provided your hardware manufacturer, such as nVidia or AMD.


Conclusion

We hope this article will help you get more performance out of your Qt 3D applications. The tools, old and new, should be very valuable to help find bottlenecks and see the impact of changes you make to your scene graph or frame graph. Furthermore, improvements regarding performance are in the works for Qt 6, so watch this space!

About KDAB

If you like this blog and want to read similar articles, consider subscribing via our RSS feed.

Subscribe to KDAB TV for similar informative short video content.

KDAB provides market leading software consulting and development services and training in Qt, C++ and 3D/OpenGL. Contact us.

The post Debugging and Profiling Qt 3D applications appeared first on KDAB.

KDAB on Qt: Training at Qt World Summit 2020

$
0
0

Qt World Summit 2020 has been postponed until October 20-22. It will take place in Palm Springs, USA.

KDAB will be running 3 one day training classes on October 20th:

  • Advanced QML
  • Multithreading in Qt, and
  • Introduction to Qt 3D

Let’s tell you a bit more about those classes before you sign up and catch the extended Early Bird discount.

Advanced QML
with Giuseppe D’Angelo

Prerequisite: Functional knowledge of QML (more than 1 year of experience)

The advanced QML course is designed to take programmers who already know QML to a deeper level of functional understanding and equips them with the cutting edge QML skills and know-how to boost their productivity at work.

Topics include:
  • Advanced integration of QML, JavaScript and C++
  • Using OpenGL in custom QML elements
  • Analysing and profiling the Qt Quick scene graph
  • Understanding and removing bottlenecks that affect a QML UI
  • Best practices for achieving optimal performances, even on constrained hardware resources

Target audience: Experienced QML developers targeting embedded and/or mobile platforms.

About Giuseppe D’Angelo

Senior Software Engineer at KDAB. Giuseppe is a long-time contributor to Qt, having used Qt and C++ since 2000, and is an Approver in the Qt Project. His contributions in Qt range from containers and regular expressions to GUI, Widgets and OpenGL. A free software passionate and UNIX specialist, before joining KDAB, he organized conferences on opensource around Italy. He holds a BSc in Computer Science.

Multithreading in Qt
with Jim Albamont

Prerequisite: Knowledge and experience programming with Qt and C++. A basic understanding of multithreaded programming is an advantage but not required.

Multithreaded programming is essential for developers to create fast and responsive applications on computers, phones, and embedded devices all with an increasing number of cores. Qt offers several mechanisms for multithreading; however, it can be difficult to know which to use and how to steer clear of common pitfalls. This course offers guidance how to write safe and efficient multithreaded code with Qt.

Topics include:
  • Basic multithreading concepts (threads, processes, data races, reentrency, shared data)
  • Synchronization primitives (mutexes, semaphores, condition variables)
  • Special concerns for Qt applications (cross-thread signals/slots, QObject thread affinity, the GUI thread)
  • Low-level multithreading with Qt (QThread, QThreadPool, QMutex, etc)
  • High-level multithreading with Qt (QtConcurrent)
  • A brief summary of atomic operations
  • Comparison between Qt and standard C++ multithreading programming

Target Audience: Qt Developers interested in multithreaded programming

About Jim Albamont

Senior Software Engineer at KDAB. Jim has actively developed with Qt since 2001. He has a background in computer graphics and data visualization, including 6 years as the lead developer of a multithreaded 3D visualization tool for financial data built with Qt and OpenGL. He has held Qt training classes throughout the US where he is based. Jim holds an MSc in Computer Science.

Introduction to Qt 3D
with Mike Krus

Prerequisite: This course requires use of Qt 5.7.1 or higher and assumes prior knowledge of Qt Quick. No prior OpenGL knowledge is required.

In this course you will learn Qt 3D and its use of modern programmable shader-based pipelines which can be applied to both OpenGL and OpenGL ES.

Topics include:
  • Drawing: Geometries, Materials and Lights
  • User Input: Picking, Keyboard Handling, Logical Devices
  • Integration and Helpers: Dynamic Scenes, QtQuick Integration
  • Scene Graph: Graphics Pipeline, GLSL, Coordinate Systems, Texturing
  • Frame Graph: Viewports, Layers, Selecting Shaders at Runtime, Post-processing Effects

Target audience: Developers who want to conveniently and efficiently integrate Qt 3D.

About Mike Krus

Senior Software Engineer at KDAB. Mike has been developing with C++ since 1996 and Qt since 2004. He has a broad range of experience in scientific applications, mainly in civil engineering and oil & gas industries. His range of expertise includes C++, QML and interactive 3D visualization software design on desktop and mobile as well as macOS development. Mike is the Qt maintainer for the tvOS platform, one of the core contributors to Qt 3D and is interested in building mobile applications with Qt, mainly on iOS. He has a PhD in Computer Science.

KDAB trainers regularly contributes insights on Qt, OpenGL, 3D, C++ and more to KDAB blogs.

See what trainees say about our KDAB training.

The post Training at Qt World Summit 2020 appeared first on KDAB.

KDAB on Qt: Qt, range-based for loops and structured bindings

$
0
0

Qt has a long history. The first stable version was released before the first version of C++ was standardized and long before the different C++ compiler vendors started shipping usable implementations of the C++ standard library. Because of this, Qt often followed (and still follows) some design idioms that feel unnatural to the usual C++ developer.

This can have some downsides for the Qt ecosystem. The evolution of the C++ programming language which sped up quite a bit in the last decade often brings improvements which don’t fit well with the Qt philosophy. In this blog, I offer some ways to work with this.

Range-based for loops

C++11 brought us the range-based for loop which allows easy iteration over any iterable sequence, including common containers such as std::vector, std::map, etc.

for (auto name: names) {
    // ...
}

When you write code like the above, the compiler (C++11) sees the following:

        {
            auto && __range = names;
            for (auto __begin = begin(names), __end = end(names); __begin != __end; ++__begin) {
                auto&& name = *__begin;
                // ...
            }
        }

It takes the begin and end iterators of the names collection, and iterates from one to the other.

Rather simple, but it is a very nice syntactical improvement to the language — it is a significant reduction of boilerplate code and much easier on the eyes.

But, it was not designed with Qt collection classes in mind. You can check out the “Goodbye, Q_FOREACH” blog post by Marc for one example where the range-based for loop collided with the Qt design principles, most notably with the copy-on-write feature because of which we got the qAsConst helper function.

Structured bindings

Another new feature, this one from C++17, are the structured bindings.

They add syntactic sugar for decomposing structures. For example, if we have a function that returns a pair of values (std::pair or a QPair) we can declare variables that refer to the values inside of the pair instead of having to access them through .first and .second.

        auto [x, y] = mousePosition();

This can significantly improve code readability. In the previous example, the names x and y communicate the meaning much better than .first and .second would.

This is even more the case if we use a function like QMultiMap::equal_range which returns a pair of iterators delimiting the range of values that are stored under a specified key in a QMap. Seeing participants.equal_range("kdab").second would look like we are accessing the second value in the map that is stored under the “kdab” key. If we used structured bindings, we could have sane variable names:

        auto [beginParticipant, endParticipant] = participants.equal_range("kdab");

Structured bindings can lead to quite succulent code when combined with the range-based for loops for iteration over STL-compliant map-like containers:

        for (auto [key, value]: stdMap) {
            // ...
        }

Each key-value pair in stdMap, will be stored in an invisible (unnamed) variable, and key and value will be references to its inner elements.

Sidebar: don’t be fooled by decltype(key) telling you key is a normal value, for all intents and purposes, it is a reference.

QHash, QMap and STL compatibility

Sadly, the previous code snippet can not work with Qt’s associative containers because the API is not compatible with that of std::map and similar containers.

The problem is in the API of the iterators for QHash and QMap. Instead of returning a key-value pair when you dereference the iterator, it returns only the value. This means that the range-based for loop can only iterate over the values stored inside of the collection, it can not (by default) access the keys:

        for (auto value: map) {
            // ...
        }

When we use the QHash and QMap iterators directly, we can access the key with .key() and the value with .value() but this does not help us with the range-based for loop. As we’ve seen, it is just a syntactic sugar which expands to an ordinary for loop that iterates over a collection automatically dereferencing (calling operator*()) the iterator in each iteration.

So, as far as the range-based for loop is concerned, the key and value member functions do not even exist.

This deficiency of the Qt’s associative containers’ API has been noticed, and QHash and QMap provide us with alternative, more STL-like, iterators since Qt 5.10 — the key_value_iterator and the const_key_value_iterator. When dereferenced, these iterators return a std::pair containing both the key and the value. To quote the Qt documentation:

The QMap::key_value_iterator typedef provides an STL-style iterator for QMap and QMultiMap.

QMap::key_value_iterator is essentially the same as QMap::iterator with the difference that operator*() returns a key/value pair instead of a value.

This means that we can use the structured bindings with them:

        auto [key, value] = *map.keyValueBegin();

But we still cannot use this with the range-based for loop to iterate over all key-value pairs in the collection. The range-based for loop will call .begin() and .end(), and not .keyValueBegin() and .keyValueEnd().

This is easily remedied by creating a simple wrapper over QHash and QMap that will rename.keyValueBegin() and .keyValueEnd() to .begin() and .end() like so:

        template 
        class asKeyValueRange
        {
        public:
            asKeyValueRange(T &data)
                : m_data{data}
            {
            }

            auto begin() { return m_data.keyValueBegin(); }

            auto end() { return m_data.keyValueEnd(); }

        private:
            T &m_data;
        };

Instead of passing a Qt associative container directly to the range-based for loop, we just need to pass it wrapped inside of the asKeyValueRange class, and we will finally be able to use the idiomatic C++17 way of iterating over key-value pairs with QHash and QMap:

        for (auto [key, value]: asKeyValueRange(map)) {
            // ...
        }

It is important to note that this is a somewhat simplified implementation of the asKeyValueRange wrapper that takes the reference to the original QHash/QMap, so it might lead to a dangling reference if used improperly.

Iteration over Qt SQL results

Another part of Qt that hasn’t been designed with common C++ idioms in mind is the Qt SQL module. Its API is designed as if it were a Java library and not a C++ one. Instead of having normal iterators over the results in the QSqlQuery, we need to use the .next() member function to fetch each result. The .next() member function returns a Boolean value denoting if there is another result, and the result itself is accessible through other QSqlQuery member functions.

Apart from the API, iteration over the QSqlQuery results has another difference to usual C++ iterators. The QSqlQuery does not need an end iterator to know whether there is another result available. If .next() or .isValid() return false, this means we have reached the end of the result set.

Having the iterator itself know when it has reached the end of the collection it belongs to is uncommon in STL, but it still is present. The input stream iterator (std::istream_iterator) is one such beast. We cannot know in advance where the end of an input stream is, we can just read values from the stream until the read fails. We have reached the end when the read failed. Similar to to the QSqlQuery— we have reached the end when .next() fails — when it returns false.

In these cases, the end iterator is only needed to fulfil the STL iterator API. It is just a dummy object (usually called a sentinel) that will trigger the validity check on the main iterator when it != end is evaluated.

C++17 brought a small change to the range-based for loop meant for this exact use-case. When C++17 compiler sees the range-based for loop from the first code snippet we had, it will convert it to the following code:

        {
            auto && __range = names;
            auto __begin = begin(names);
            auto __end = end(names);
            for ( ; __begin != __end; ++__begin) {
                auto&& name = *__begin;
                // ...
            }
        }

The difference is easy to overlook.

        auto __begin = begin(names), __end = end(names)

is replaced by

        auto __begin = begin(names);
        auto __end = end(names);

While these two snippets look mostly the same, there is an important difference — in the first snippet, both __begin and __end need to have the same type whereas they can be different in the second.

This allows us to create a begin function that returns a powerful iterator that knows when it has reached the end of a collection, while the end function returns a dummy value — a sentinel.

The sentinel can be just a simple empty type:

        struct QSqlResultSentinel {};

        QSqlResultSentinel end(QSqlQuery& query)
        {
            return {};
        }

The iterator is where the main logic lies. For it to work with the range-based for loop, it needs to know how to do the following operations:

– It needs to have the operator++ that moves to the next result; – It needs to have the operator!= which takes a sentinel object and returns whether iterator is valid or not; – It needs to have the operator* that dereferences the iterator.

The basic implementation of the operator++ and operator!= would look like this:

        class QSqlResultIterator {
        public:
            QSqlResultIterator(QSqlQuery& query)
                : m_query(query)
            {
                m_query.next();
            }

            QSqlResultIterator& operator++()
            {
                m_query.next();
                return *this;
            }

            bool operator!=(QSqlResultSentinel sentinel) const
            {
                Q_UNUSED(sentinel);
                return m_query.isValid();
            }

            // ...

        private:
            QSqlQuery& m_query;
        };

        QSqlResultIterator begin(QSqlQuery& query)
        {
            return QSqlResultIterator(query);
        }

The only thing that remains is for us to decide what the dereference operator should do.

Since each record in the result can contain several values, it would be nice if we provided the operator[] to access those values. Therefore, when we dereference the QSqlResultIterator, we want to get a type that has operator[] defined on it which returns values from the current record.

We have several options on how to do this. The simplest, though not the cleanest, is to have the dereference operator return the reference to the iterator itself, and then define the operator[] in the iterator class.

        class QSqlResultIterator {
        public:
            // ...

            QSqlResultIterator& operator*()
            {
                return *this;
            }

            QVariant operator[] (int index) const
            {
                return m_query.value(index);
            }

            QVariant operator[] (const QString& name) const
            {
                return m_query.value(name);
            }
        };

If we weren’t interested in having the operator[] to access the values, then we could just return the current QSqlRecord with m_query.record() from the operator*().

While this is not a complete iterator implementation (we are missing iterator type traits and similar), it is sufficient for us to be able to use it with a range-based for loop:

        for (auto result: query) {
            qDebug() << result["name"] << result["surname"];
        }

We’ll see what we need to do in order to be able to use structured bindings with Qt SQL in the next part of this post.

About KDAB

If you like this blog and want to read similar articles, consider subscribing via our RSS feed.

Subscribe to KDAB TV for similar informative short video content.

KDAB provides market leading software consulting and development services and training in Qt, C++ and 3D/OpenGL. Contact us.

The post Qt, range-based for loops and structured bindings appeared first on KDAB.

Viewing all 15410 articles
Browse latest View live